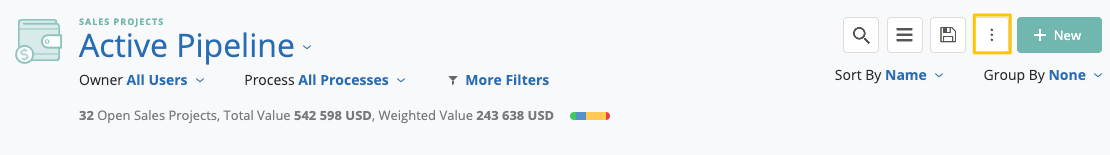
The Active Pipeline view is by default your starting page when you log in to Membrain. Here you can see a visual overview of the health of your pipeline, which stage each sales project is at within a sales process, how healthy each sales project is, along with lots more useful information at a glance.
Watch this short video for an overview of the Active Pipeline view.
Options, at the top of this view, allow you to choose sales projects you would like to see, by the user or by the team. Choose which process you would like to include, and go even further with filters, sorting, and grouping to give you the exact information you need. More on this below.

You can also use the 5 selections in bold blue text to filter what you want to see.
Below this, you will find a line of text that shows you the number of sales projects, total value, and weighted value for the sales projects shown. To learn more about how Membrain calculates the weighted pipeline, read this article about Membrain Terminology.

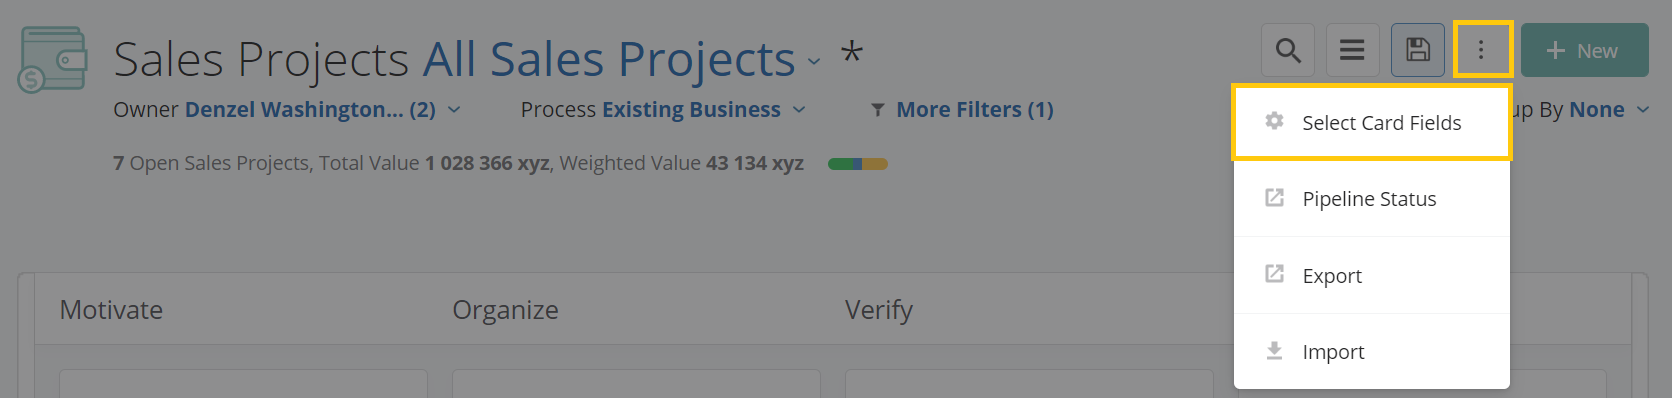
To the right, you can create a new sales project, find a project within this view, toggle between the project list view and the Active pipeline view, create and load saved Views, and from the more menu  Click to see a helpful Pipeline Status summary.
Each stage of your Sales Process is represented by the columns you see in this view. And each Sales Project is represented by a card with relevant information. These sales projects move through the pipeline from left to right, passing through each stage of the process from beginning to end of your sales cycle.
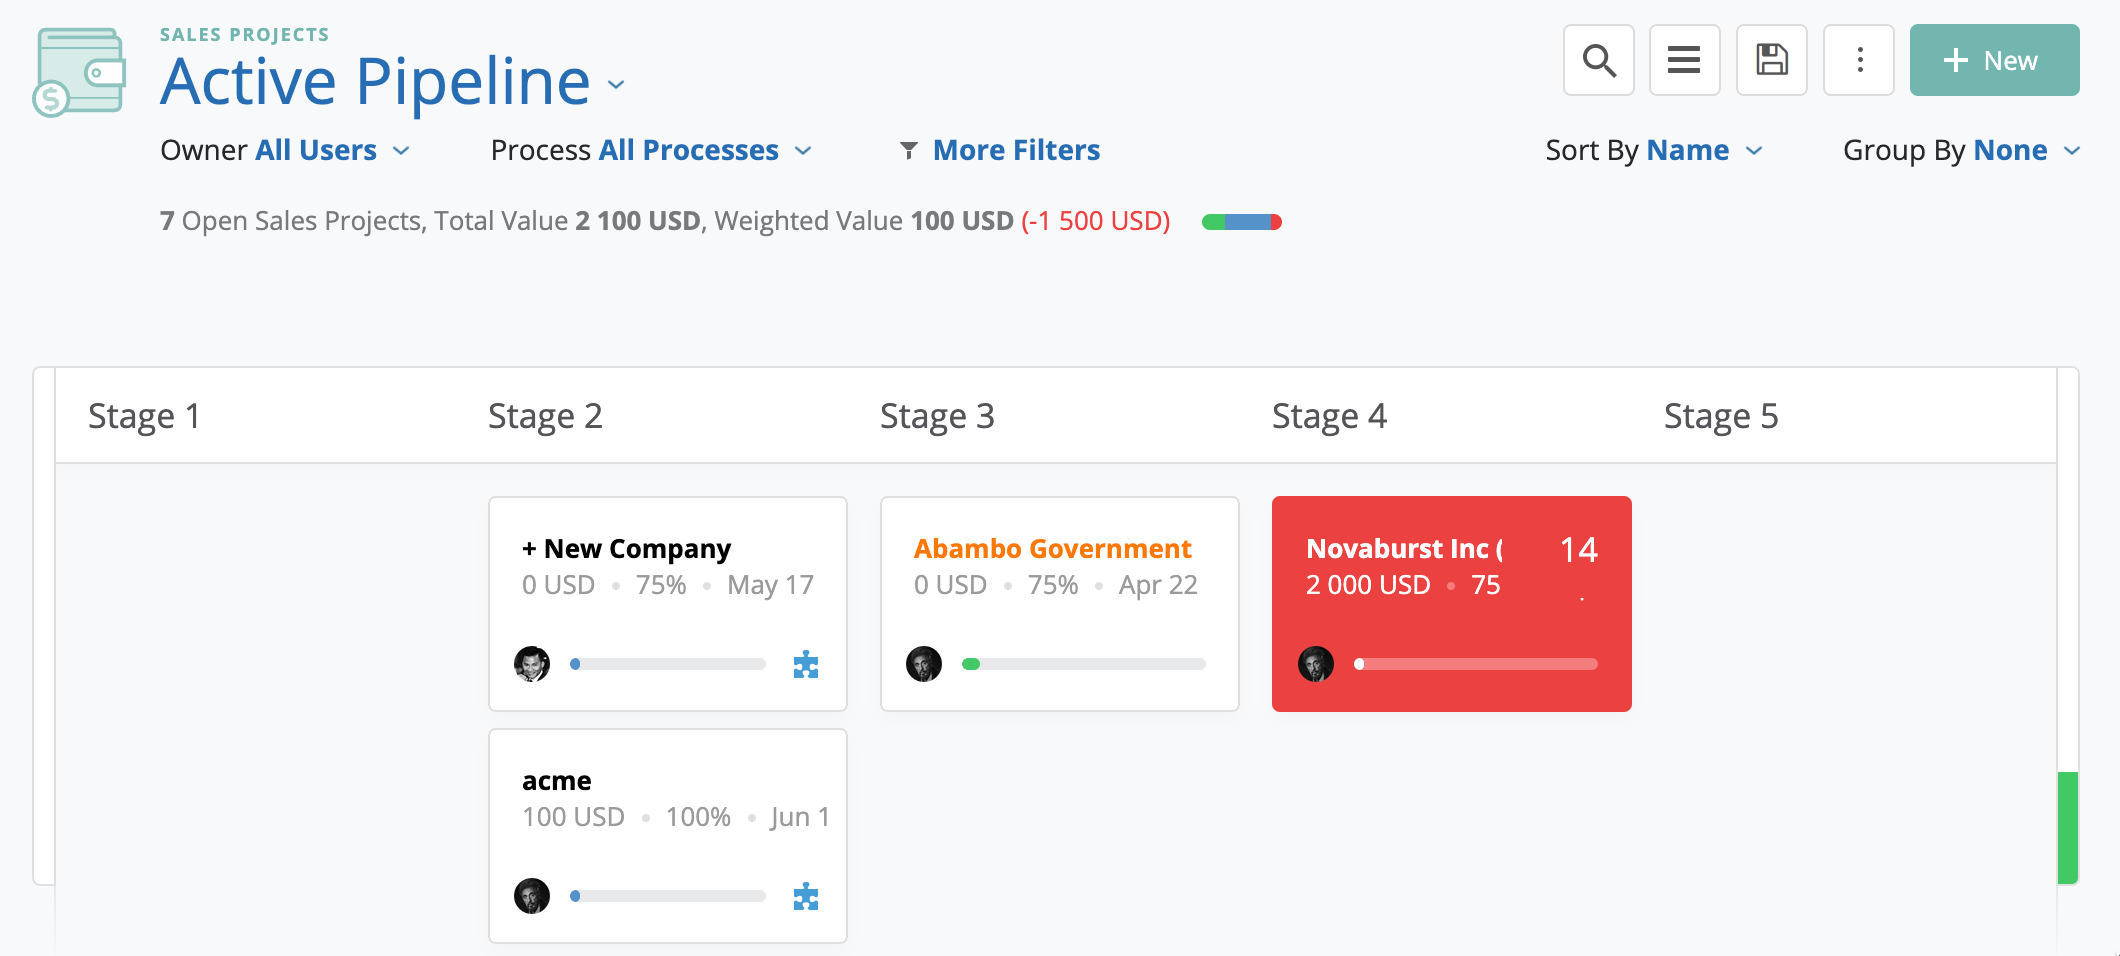
The cards that you see here in the Active Pipeline view represent open Sales Projects in the pipeline. These cards, by default, show the following information:
It's easy to customize the information that is shown in these cards, and add additional information that you can see at a glance. This is helpful if you want to see additional Project or even Company Level details, right here from the Active Pipeline view.
3 additional fields can be added to a Card at any one time, and anyone can create their own view that shows the information that's important to them. This view can of course be saved as a View, making these unique views easy accessible, when you need them.
To add fields to a Card, follow these simple instructions:
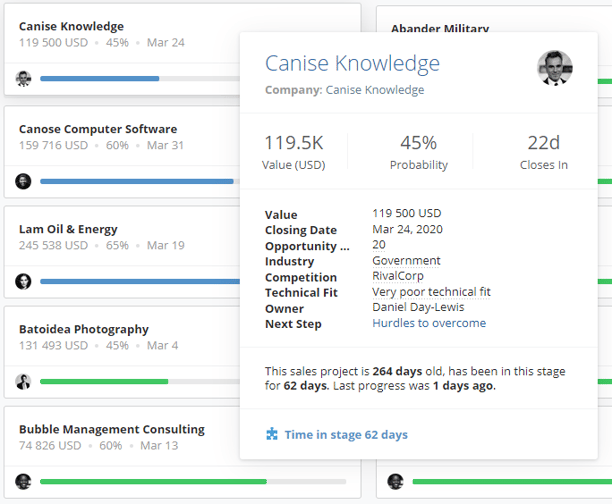
When you're in the Active Pipeline view, you can hover over the Sales Project name to see a snapshot of the most important information tied to it.
The information shown in the view is easily customizable allowing you to choose which information is displayed and in what order. Administrators can customize this view. Click here to learn how.
The colors that you see in the Active Pipeline are important and help you understand what the health of a sales project is, at a glance.
There are 3 different alerts that can be triggered, based on rules in your process, and on the steps themselves. These settings are configured by your administrator on setup.
![]() Blue Puzzle Piece - coaching advice is the first level and shows you that something needs to be addressed, even if it is not urgent yet.
Blue Puzzle Piece - coaching advice is the first level and shows you that something needs to be addressed, even if it is not urgent yet.
![]() The next level is a yellow flag, where quick action is required to address the problem at hand.
The next level is a yellow flag, where quick action is required to address the problem at hand.
![]() The final level is the red flag – this is the most serious of warnings Membrain can give and it should not be ignored. Something very important has been missed that may impact the success of this opportunity or prospect.
The final level is the red flag – this is the most serious of warnings Membrain can give and it should not be ignored. Something very important has been missed that may impact the success of this opportunity or prospect.
This tool shows the overall health of your Sales Projects. Hovering on the Health Bar gives you a preview of the health conditions.

Clicking on one of the health conditions applies it as a filter. For instance, if you select "Yellow Flag" from this preview dialog you will only see the Sales Projects that have a Yellow flag as the health condition.
To reset the filter and switch back to see all your Sales Projects, you simply hover on the Health Bar again and click Clear Health Filter.

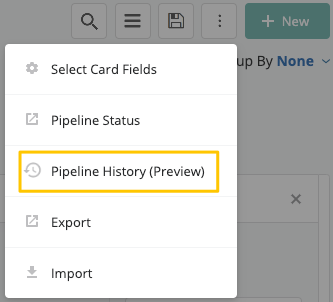
The Membrain Active Pipeline view also offers the powerful functionality of a Pipeline History Viewer, which allows you to observe the historical evolution of your pipeline. With this feature, you can revisit how your Pipeline appeared in the past 90 days, a capability that is tremendously helpful for retrospectives, strategy adjustments, and learning from past trends.
While in the Active Pipeline view, click on the three dots menu in the top right corner of the view to reveal additional options.
Select 'Pipeline History Viewer'. This option gives you the ability to view your pipeline as it was up to 90 days ago.
Basic filtering from the Pipeline view will apply to the Pipeline History Viewer as well (like Owner and Process).
Once in the Pipeline History Viewer, you'll notice a timeline with tools for navigating through your pipeline's history. Here's how to use them:
To move step by step through your pipeline's history, use the forward and backward arrows.

To watch your pipeline's evolution play out automatically, use the 'play' button. You can pause this playback at any time.

To go to a specific point in your pipeline's history, click anywhere on the timeline's scrubber.

This feature provides a unique opportunity to observe trends and changes in your pipeline over time. By taking advantage of the Pipeline History Viewer, you can gain deeper insights into your sales processes, further informing your strategies and improving your future outcomes.
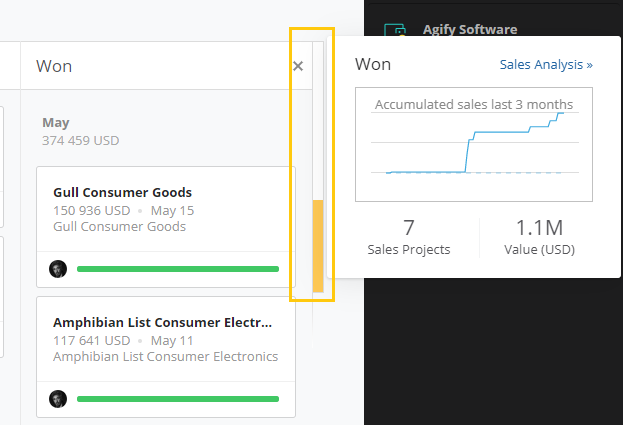
Click on the toggle bar to the far right of the stages to see sales projects that you have archived or won over the last 3 months. Hover over the toggle bar to get their statistics at a glance.
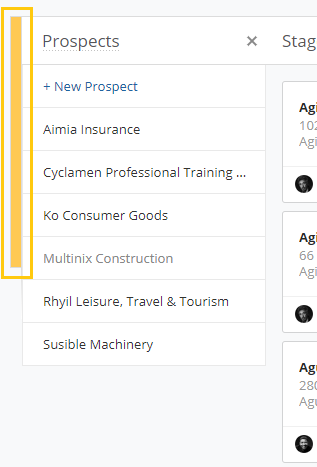
Or click on the toggle bar to the far left of the stages to see your current prospects in a helpful list view. If you know they are ready to enter the pipeline, you can simply drag and drop them from this view into the stage they belong to.