Help us spread the word about how great Membrain is and write a review on G2Crowd
Update on January 20, 2021
Help us spread the word about how great Membrain is and write a review on G2Crowd
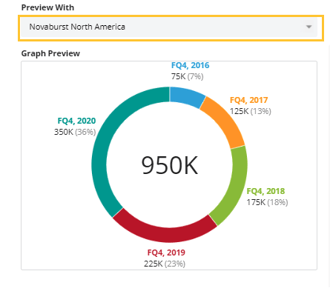
Product Revenue Graphs are the latest edition to our new Account Growth Module. You can now add this as a component under Graphs.
This specific type of graph allows you to drill down into specific revenue information connected to projects on the account. It allows you to gain insights and plan for the year ahead on an account level.

What are some examples of this?
Performance- You might want to create graphs to include information about products that are generating the most revenue per quarter.
Tracking milestones- You can track milestones and recurring payments so that can help you accurately forecast expected revenue.
Flexibility- Product Revenue Graphs allow you the flexibility to view information on all the projects you are working on within an account and enable you to visualize the progress.
New Opportunities - Identify white space where you have additional opportunities to position new products or services.
From north to south, east to west, Membrain has thousands of happy clients all over the world.


