Not all pipeline changes are created equal.
A deal that changes value once during its lifetime is usually nothing to worry about. But a value that is constantly increasing, decreasing, or being re-estimated can be an early indicator of uncertainty, changing customer requirements, or forecasting risk.
That's why we've introduced Value Change Count - a new metric that helps sales managers quickly identify how often the value of a Sales Project has changed over time.
Spot Deal Volatility at a Glance
Value Change Count is now available throughout Sales Projects Dashboards and List Views, making it easy to see the number of times a Sales Project's value has been updated.
Much like the existing Closing Date Change Count, this new field provides valuable context that goes beyond the current value of a deal. While some changes are expected as opportunities develop, frequent adjustments can highlight deals that need closer inspection, additional coaching, or a more realistic forecast.
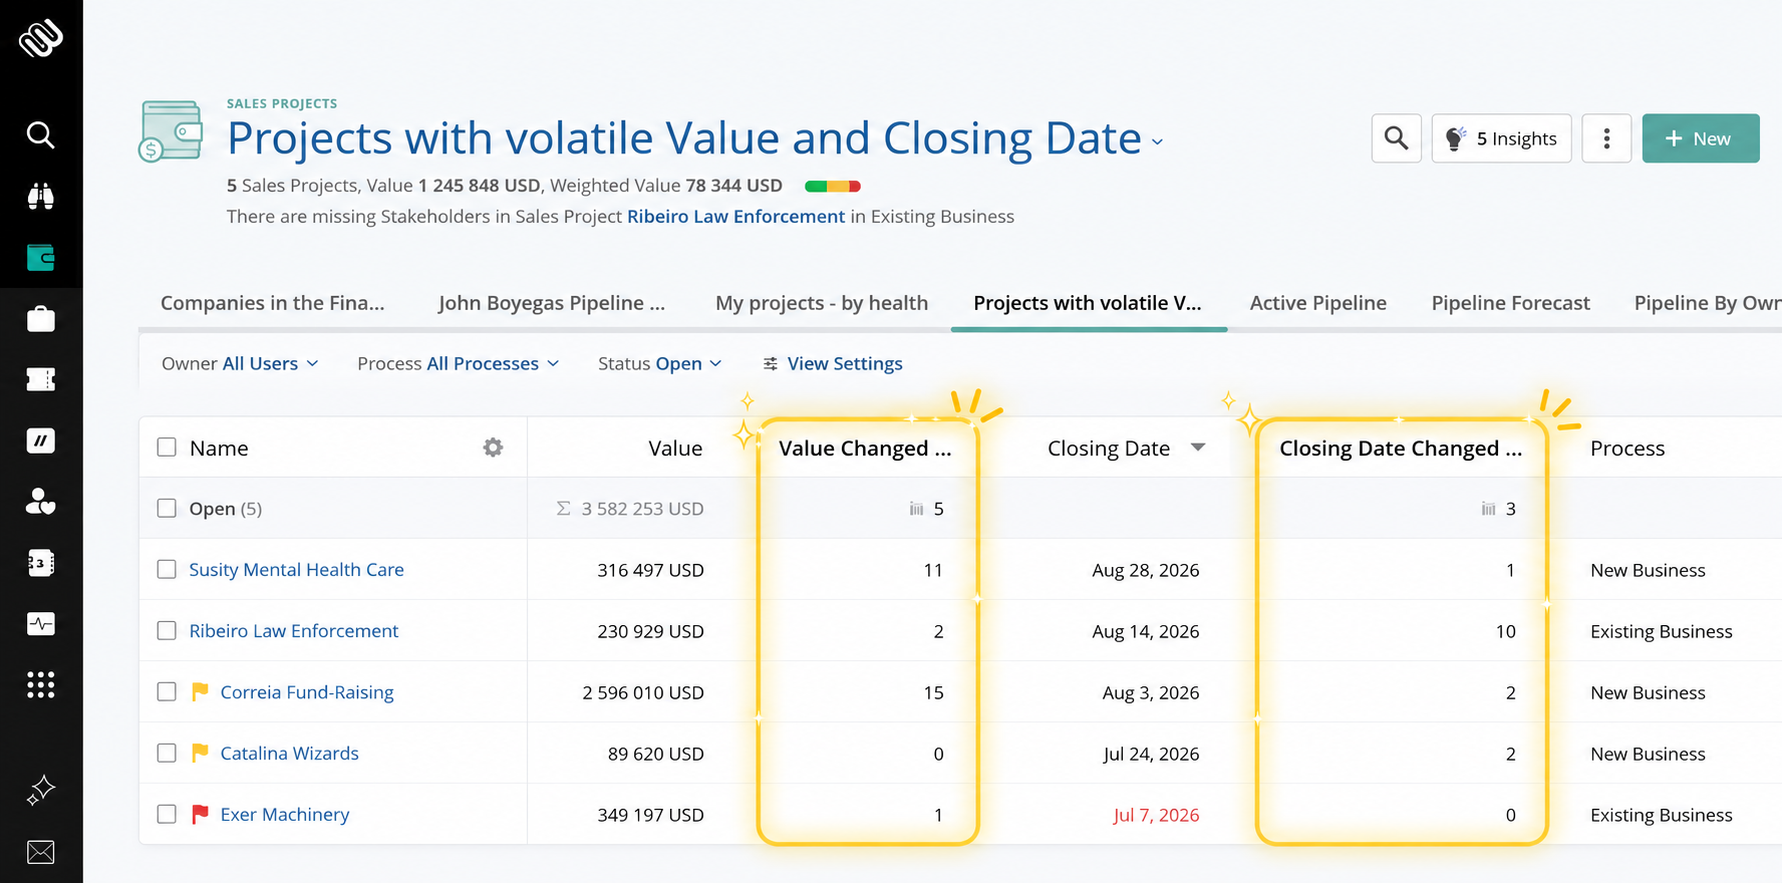
Filter and Highight the Sales Projects that Matter Most
Value Change Count isn't just visible. It can also be used to filter your pipeline.
Using the same familiar filtering options as Closing Date Change Count, you can quickly find opportunities where deal value has changed:
- A specific number of times
- More or less than a chosen threshold
- Within a defined range
Whether you're reviewing forecast accuracy, identifying unstable opportunities, or preparing for pipeline reviews, it's now much easier to surface the deals that deserve additional attention.
We hope this new metric gives your team even greater visibility into pipeline health and helps you make more confident, data-driven sales decisions.
Help us spread the word about how great Membrain is and write a review on G2Crowd