Knowing what you sell is useful. Knowing when it’s coming in is what makes it a forecast.
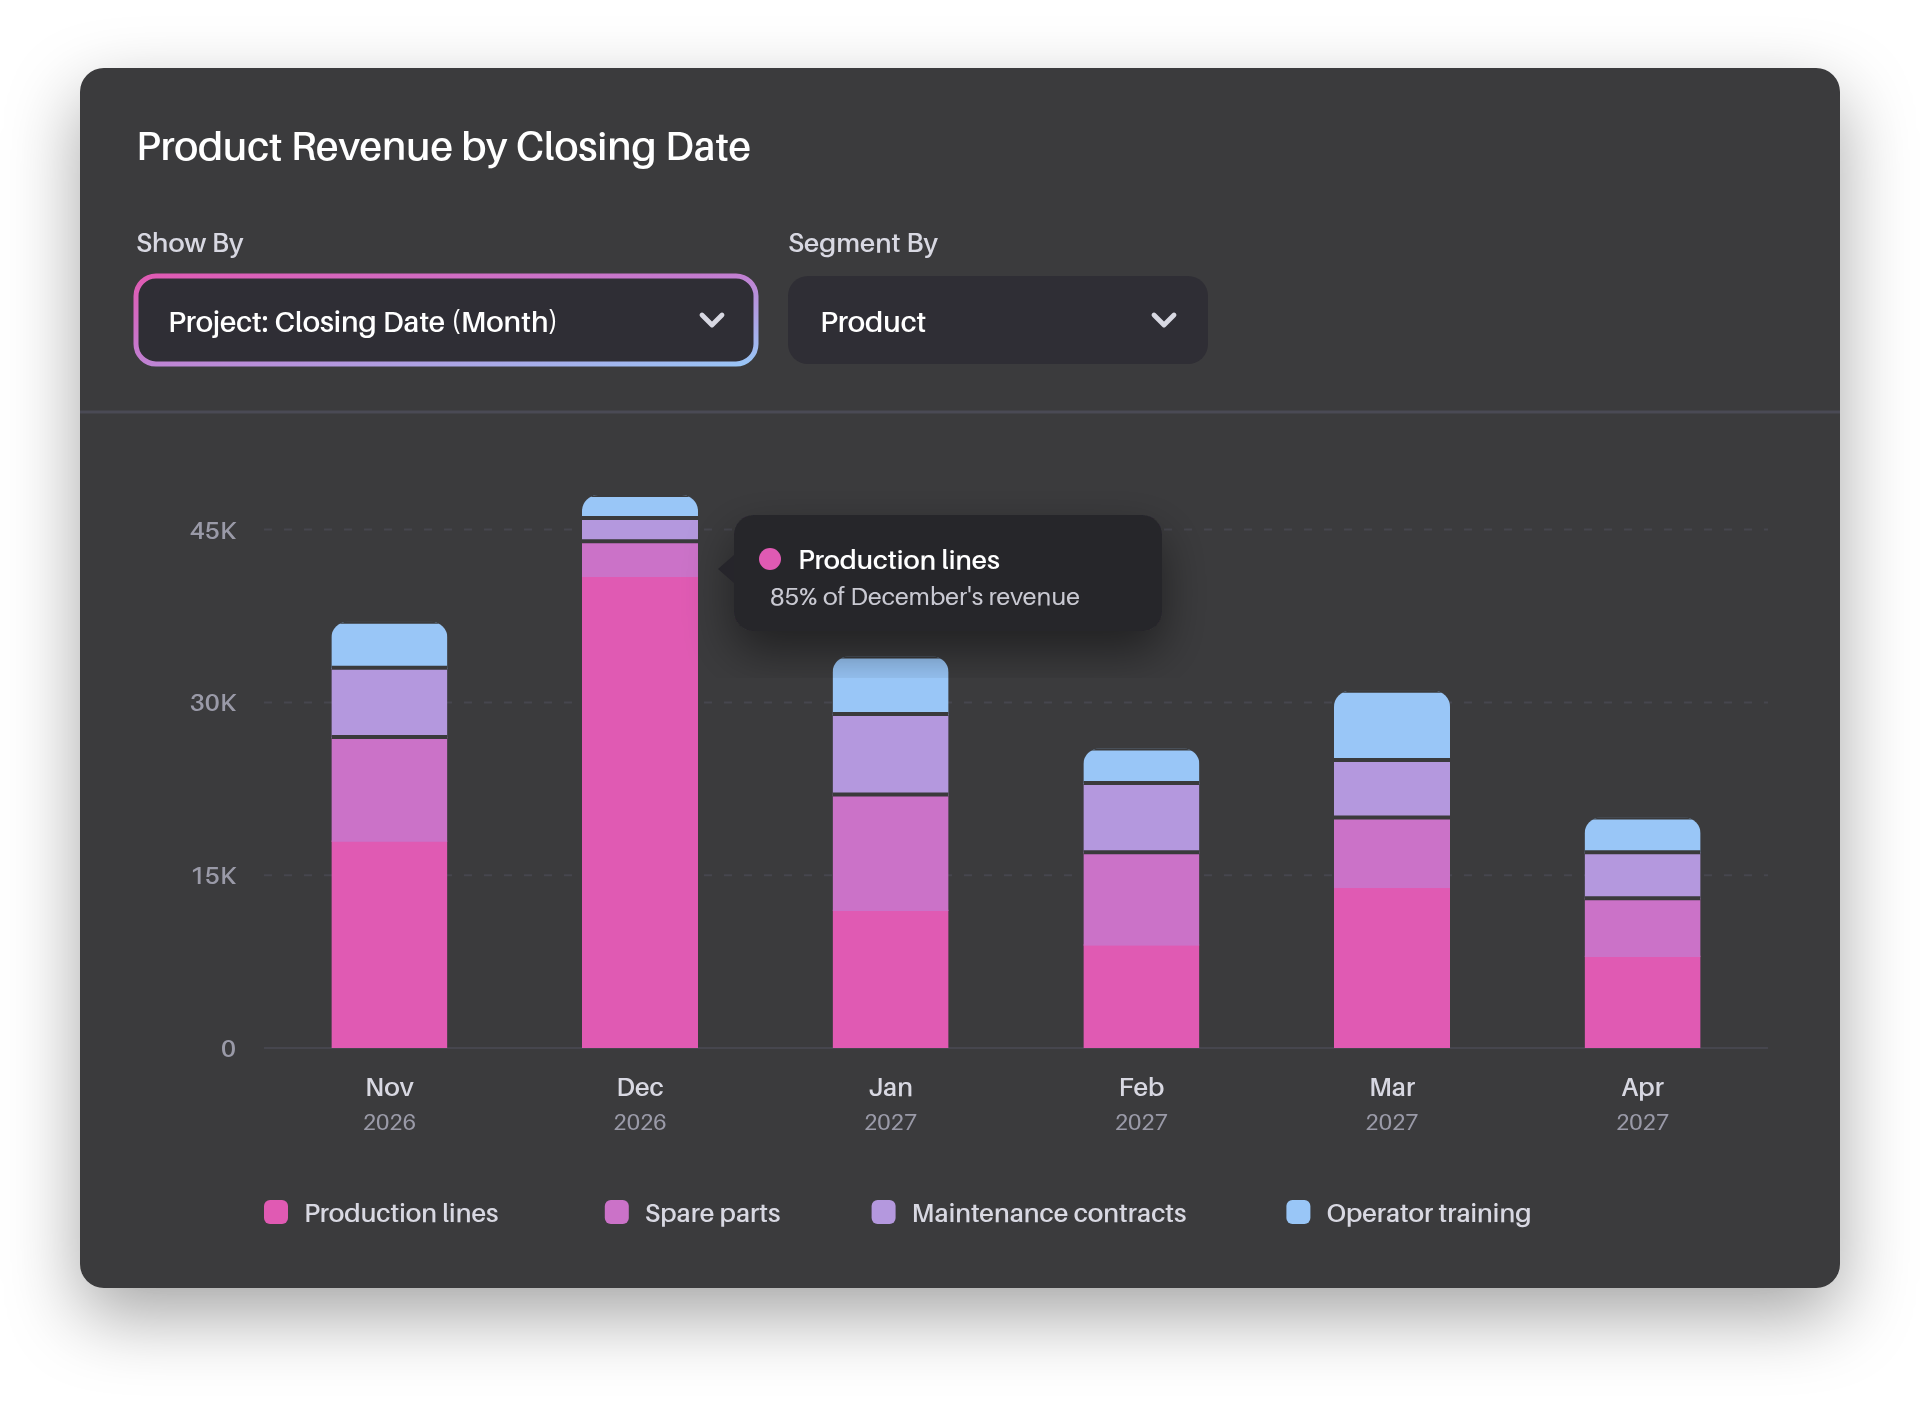
With this release, the new Product Revenue Graphs can group and segment your data by Sales Project Starting Date and Closing Date, so you can see how product revenue develops over time.
From filtering by date to grouping by date
Until now, the Starting and Closing Dates of your Sales Projects were available in these graphs as filters, as sort options and as columns in list graphs. They’re now also available as grouping and segmentation dimensions.
That small step changes what a graph can show you. Instead of narrowing your data to a time period, you can lay the revenue out along it, and split it by product, customer or anything else you already use.
What you can see
- Revenue by closing date. See which products make up the revenue you expect to land, and when.
- Revenue by starting date. See which products your newest projects are bringing into the pipeline.
- Both, segmented. Combine either date with the other fields available in the graph to compare and spot patterns.
A quick example
You’re preparing a forecast review. You open your dashboard, build a Product Revenue Graph, and group it by Closing Date. Then you segment it by product.The graph shows which products dominate the revenue due to close next, and which periods lean heavily on a single product. If one product carries most of an upcoming period, that’s a conversation worth having before the review rather than during it.
Give it a try today
Create a new Product Revenue Graph on your dashboard, or open an existing one, and look for Starting Date and Closing Date among your grouping options. Our Help Center has guides to get you started, and the team is always happy to help.
Enjoying using Membrain? Great!
Help us spread the word about how great Membrain is and write a review on G2Crowd
Help us spread the word about how great Membrain is and write a review on G2Crowd