At Membrain, we're all about streamlining workflows, working smart, and helping your day run as smoothly as possible. So with that in mind, we've made it possible to send emails to stakeholders automatically... when the time and situation is right.
Of course, most of us appreciate that emails are best received when they are written with one person or project in mind.
Disclaimer: if you believe sending 100's of generic emails to a contact list in the hope that something might stick is a good strategy, then please stop reading now!
But if done well, there can be place for well written templates and automated emails where an update or nudge along the way is needed, after a certain event has occurred.
So how does this new feature work?
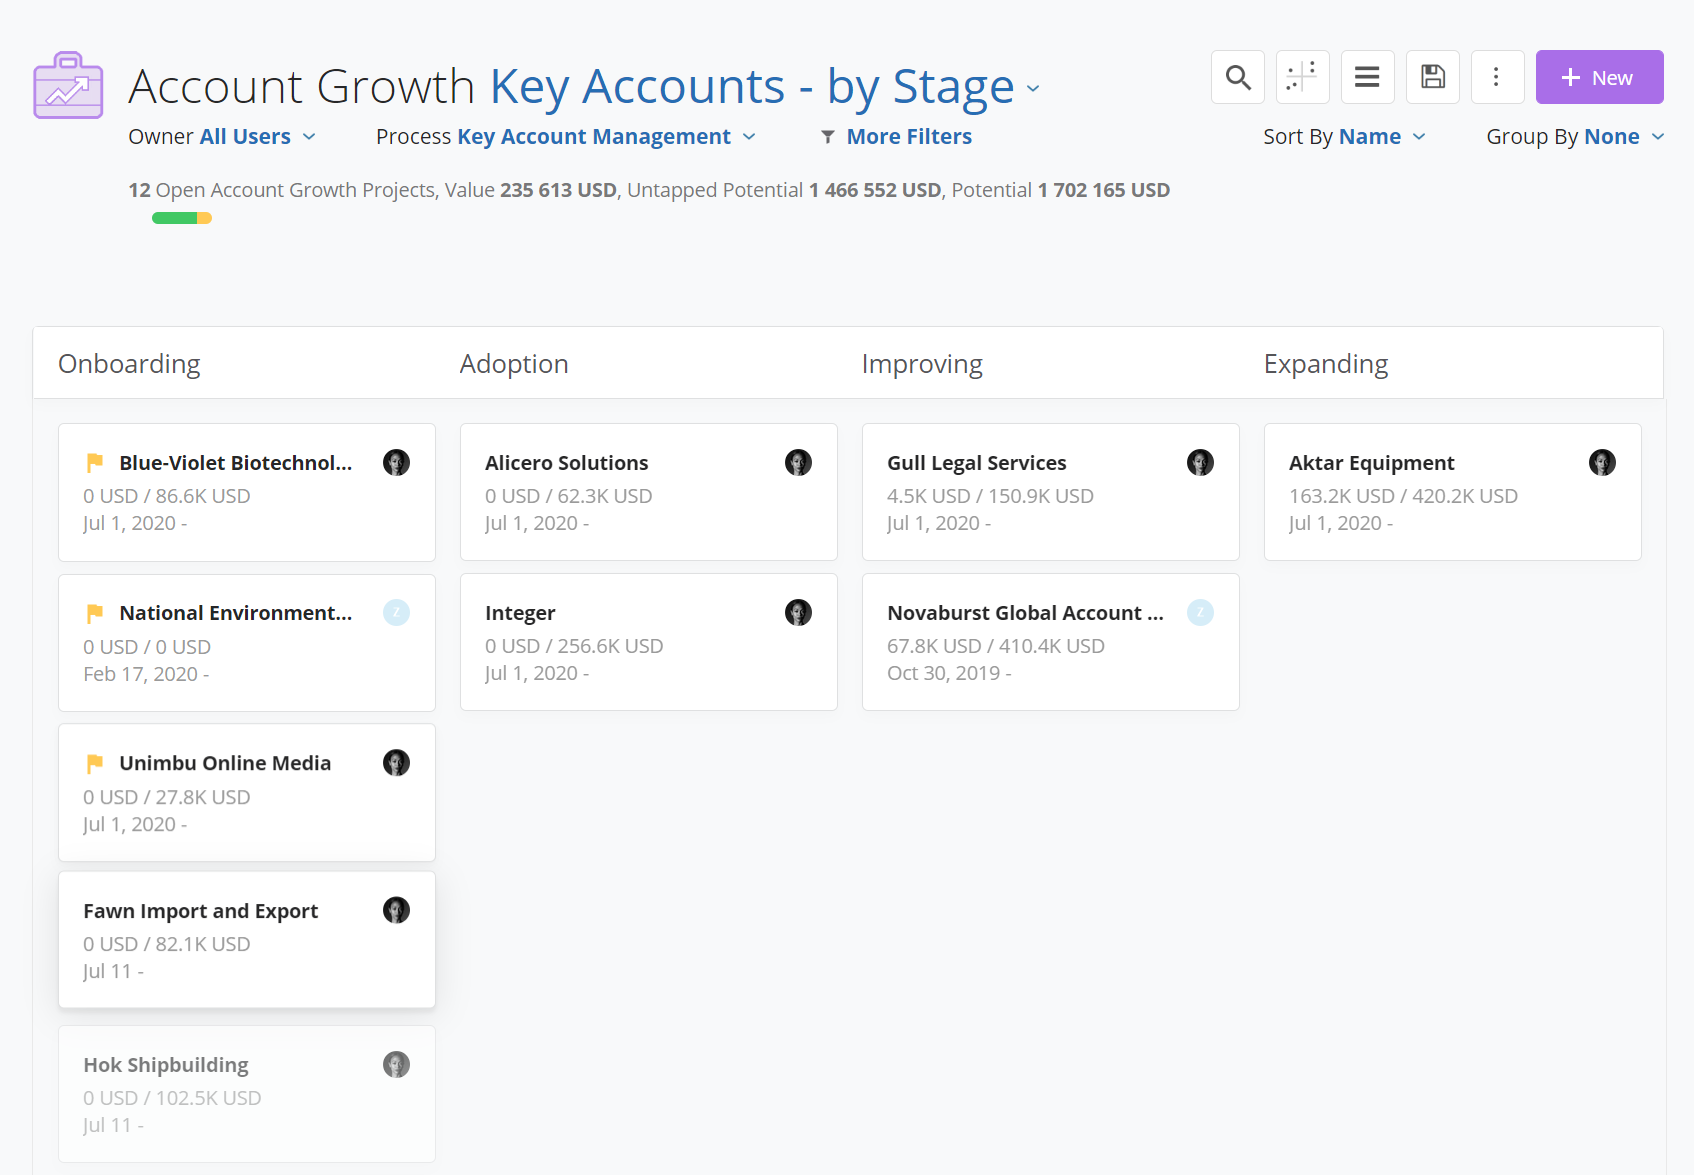
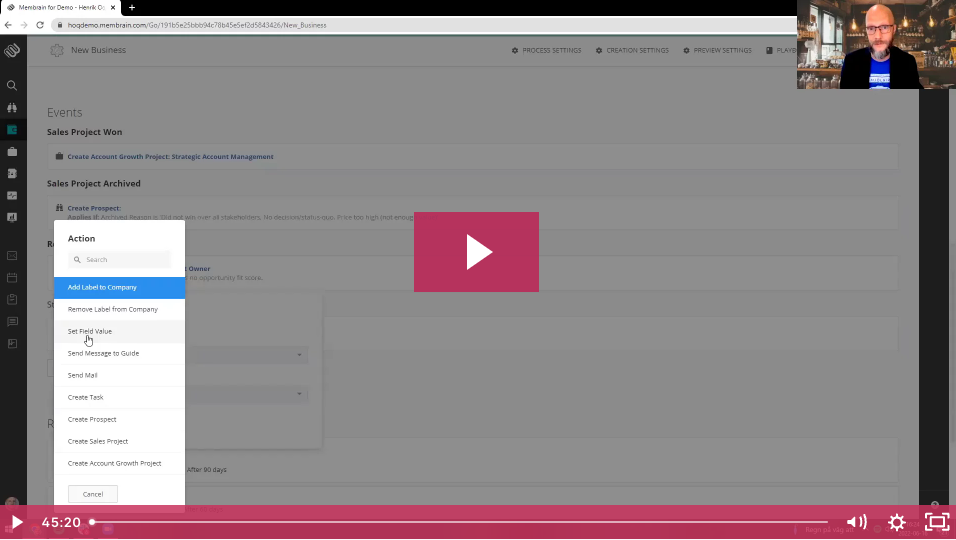
Saving time with email templates is one thing, but taking the next step to configure Membrain to know when to send the email is a whole new level. Using Automated Events in your Prospecting, Sales Projects, or Account Growth Projects as the trigger to send an email makes this an easy tool to configure. Additionally, you choose who you want the email to be sent from, giving you that extra control you want.
And when is it best used?
There are so many great use cases where this can be very powerful. Lets take a look at just some examples of how this can make you and your team super efficient:
- When a project is Won - send an automatic email to the Decision Maker to say thank you for their business, or perhaps include relevant information from The Content Hub
- When a project is Archived - reach out to your Main Contact and ask for feedback - even include a Membrain Form for completion
- When a Quote is sent - send additional agreement info or pdf's related to the quote
- Or create a step simply for triggering an email, and use Conditions to only send to certain stakeholders with certain interests, from a certain industry, or at a certain stage in the process
Excited to give it a try?
We know this new feature is going to make a lot of sales people very happy, so pop straight over to the Help Center and learn how Automated Events can work even harder for you.
And of course, if you need any help getting started, just reach out to us and we'll be ready to help get you started.
Help us spread the word about how great Membrain is and write a review on G2Crowd