Today we’re doing a round up of our most popular productivity functions in Membrain.
We’ve got some that are shiny and new and some that are old, but still gold. If you’re sick of software annoying the crap out of you, then this post is for you!
In fact, our team claims these productivity functions greatly improve their enjoyment of using software. Instead of being the annoying little brother that pesters you with questions, Membrain is like the cool older sister that helps you sail past the queue at the ice cream parlor on a hot a day because, well, she’s just so cool and makes life seem so easy.
So no more terrible, horrible, no good, very bad days using your CRM. Instead, pass Go and collect €200 with...
Keyboard Shortcuts:
- C for Calendar
- M for Mail (Sales Inbox)
- S for Search
- T for Tasks
- G for GoTo Menu
- H for Content Hub
- V for Comments
- Ctrl + right/left arrow to jump to the next sales project or prospect
- Ctrl + S for Shortcuts
- Within your email composer you have quick access to shortcuts, making it easy to insert a Snippet, Membrain Meet Link or Personalization.
Or Favorite:
- A snippet
- An email template
- A dashboards
You can also spread your comments like wildfire with
- Centralized Comments area (live feed)
- Ability to comment on an email from the sales inbox
….#YouGoGossipGirl
P.S. - A huge achievement for Sales People Collaboration and Coaching for Management. ...
...Or get the party started with Multi-Person Membrain Meet!
Nina, our Head of People, is loving our new ability to schedule meetings with multiple colleagues. It allows her to quickly spot the gaps between multiple calendars, making it easy for her AND the people she invites to the meeting.
Sebastian, our Sales Manager, is able to jump back and forth between different views in milliseconds with keyboard shortcuts, saving him time, headaches and money.
George, our CEO, couldn’t live without the GoTo Menu allowing him to navigate to menu tools like Dashboard, Contacts, Pipeline or Settings, with just one stroke of the keyboard.
How many times per day do you navigate to the menu? 10, 50, 100, 500 times? Between the mouse scrolling and clicking, each time is probably taking you 3-5 seconds. Costing you potentially 42 minutes per day. At a minimum it’s costing you one minute. Just to navigate to a menu, find and access what you are needing. Those minutes add up!
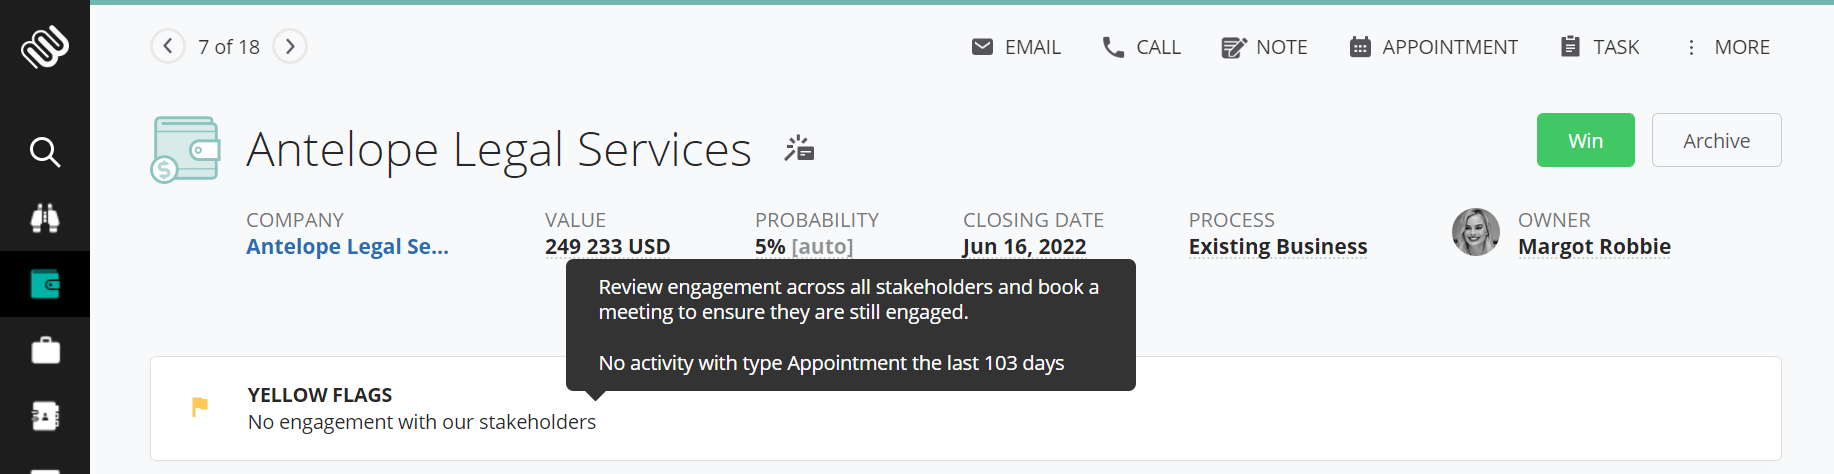
You don't have to be a power user to get in on these time saving productivity functions in Membrain, so why don't you give them a whirl and let us know how you like them!


-2.png?width=566&name=image%20(3)-2.png)
-2-1.png?width=565&name=image%20(2)-2-1.png)


