We are proud to announce the launch of Membrain Automations - a brand new tool that helps save time by automating tasks, allowing your team to focus on what's important.
Automations can perform a sequence of Steps for a given item in Membrain. They can execute across Membrain's platform to take care of tasks on a Company, Contact, Prospect, Sales Project or Account Growth Project. They are also versatile, allowing you to enroll an item in Automation manually one by one, in batch, from a process step or via an automated process event, or use automatic enrollment criterias.
There are so many ways Automations can help Membrain work smarter for you and your team. Here are a few ideas on how you can use Automations:
⚡ Automatic Prospect Assignment
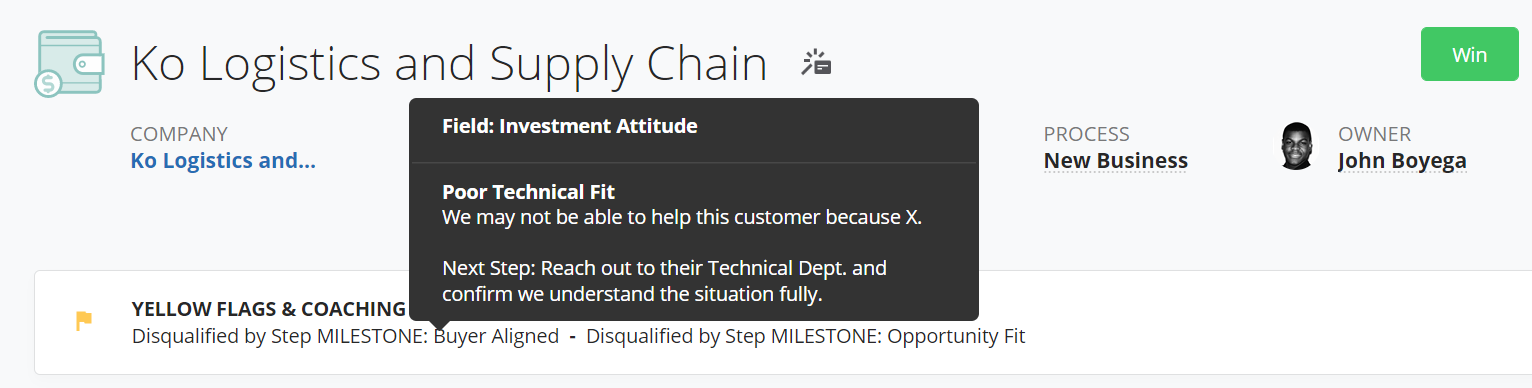
Use conditional steps and randomization to automatically assign Prospects based on any number of factors such as territory, prospect size, product interest and more.
⚡ Automatically Archive or Renew Account Growth Projects
If you run Account Growth Project on a year-to-year basis you can easily setup an automation to close down last year and set up a new one for the next.
⚡ Data Clean-Up And Categorization
Leverage automations to set data based on existing data points. Eg. set a more easily filterable NPS Category based on an NPS score field.
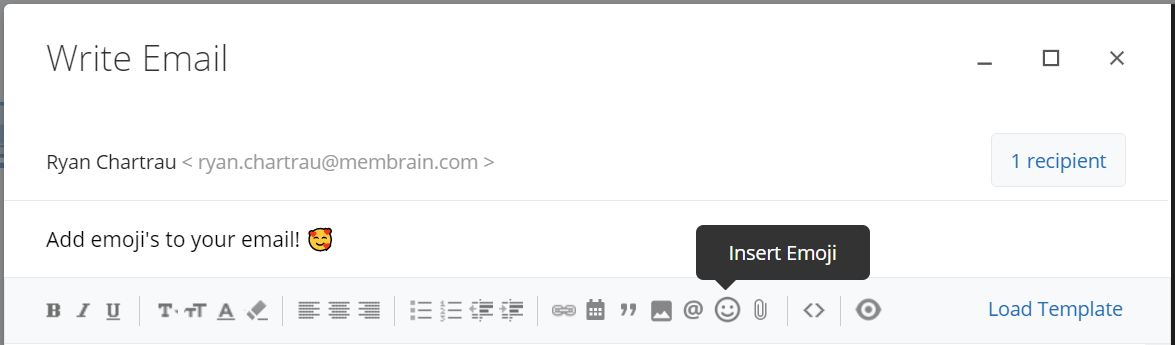
⚡ Automate Email Flows
Use automations with Wait steps and Email steps to send customizable email
sequences to your Contacts.
"Remember, with great power comes great responsibility"
We're excited to have Membrains Automations live and available to our customers, but also want to stress that it is a very powerful tool and should be used with care and consideration. If you're keen to learn more about what Automations can do for you, please reach out to our Customer Success team at support@membrain.com and we will enable it for you and walk you through it.
In the meantime, if you'd like to learn more about how Automations work or get some more ideas and inspiration on how you can use them in your business workflows, go ahead and check out our Help Center Article - Automations - An Introduction
Help us spread the word about how great Membrain is and write a review on G2Crowd
.jpg?width=218&height=472&name=Screenshot_20221105-001306%20(1).jpg)
 Default Value Fields - useful when you want to ensure certain info is always included in a Form