Do you know which opportunities are your slam dunks? Your low hanging fruit, your bread and butter? What about your stay aways – those opportunities that, despite your best efforts, never seem to close?
If so, great! If not, don’t worry. Membrain’s Win/Loss analysis can help you identify the types of deals you can consistently win, and more importantly, understand why.
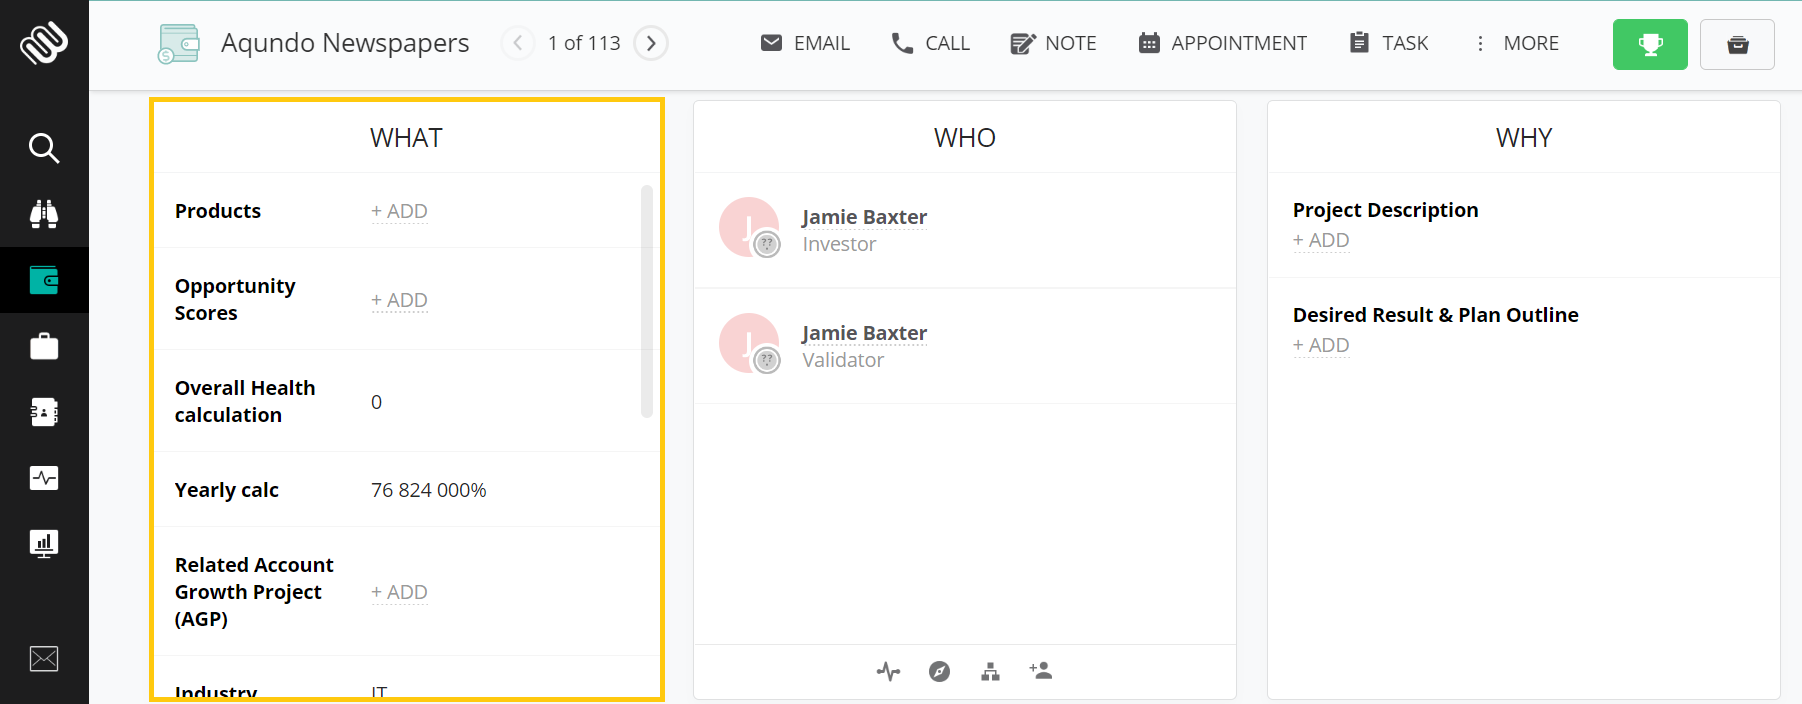
Best of all, your sales representatives don’t need to spend all their time on data entry to generate actionable insights – any information captured in the left-hand box inside an opportunity is automatically added to Membrain's analysis.
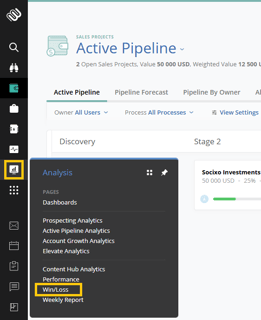
To get started, just navigate to the "Analysis" area of your Membrain instance and click on Win/Loss.

Next, you'll want to specify the overall information you’re looking for.
Click on blue text to select:
You can also use create new filters, taking into account custom criteria you're tracking such as competitors or investment attitude.
A quick snapshot of the number of deals you've won and lost, based on your selected options, as well as a breakdown by percentage or value.

What is your current win rate? And what reasons are your sales team providing for winning or losing deals? Let Membrain do the math for you, and you can focus on adapting your overall sales strategy.
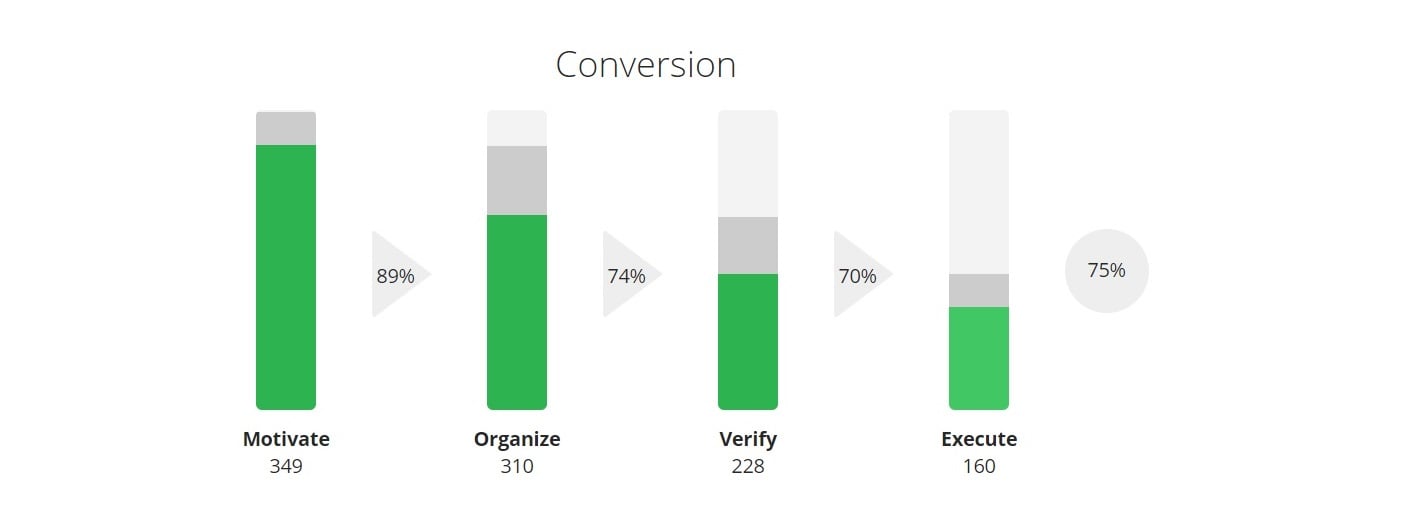
Conversion breaks down the win rate for projects as they reach specific stages in your sales process, which can help you adjust the length of time a stage should last, as well as forecast the probability of a win for opportunities in the later stages.

Membrain takes all the data you provide about wins and losses, then identifies those factors that are truly impacting performance.
For example, are there products or service packages that only appeal to customers within specific industries? Are there any customers out there with a particular set of challenges that you could offer a unique solution? By finding opportunities with similar characteristics to past wins, you can drastically improve your win rate.
On the other hand, there may be factors that don't have all that much impact on your sales results; these factors are listed in the middle section, and can help you manage your time effectively by engaging more often with customers that are a realistic fit for what you're selling.
Finally, Membrain will list the defining factors of your lost sales projects...perhaps you never win over prospects where tenders are required, or when you're up against a specific competitor within a specific customer segment? Either way, Membrain will help you take a closer look at how you approach these opportunities. To get really granular, you can click on a type of influencer, industry for example, and you'll be able to view comparative data.

How long is your sales cycle? What's the average age of sales projects that you've won? How much time are you spending on lost opportunities?
In this area, Membrain shows you how much time is going by, from the moment an opportunity is created, until the moment it either gets archived (lost) or won - and that goes for every sales project in your data selection.

How quickly do projects move through the stages of your sales process? Is there any stage in particular where certain deals tend to lose momentum? By providing the average length of time your opportunities are spending in each stage, you'll learn exactly when it pays to be proactive.

To take this concept even further, how often do your opportunities lose momentum? How long do they tend to stall before momentum picks back up? And how much more often do lost sales projects stall in comparison to won sales projects?
To the left of this graph, Membrain will display the average amount of time that won opportunities in the past have stalled for, which should help you forecast opportunities in the future.

What’s the average value of deals you've won versus deals you've lost? Does your win rate depend on occasional "megadeals," or are you winning lots of smaller deals on a regular basis?

How many activities are getting logged on opportunities you've won? And how does that compare to opportunities you've archived? Membrain helps you visualize the amount of effort required to make the sale.

How important is it to have all stakeholders identified during the sales process? In the case of competing interests, you may need to convince several people at once, sometimes with very different objections. Or perhaps in your industry, it makes more sense to prioritize relationships with one or two decision makers. Either way, you'll know whether or not you need to be uncovering more key players.

How much time are you spending on activities during the sales process? Membrain gives you the average amount for both won and lost opportunities, and demonstrates how activity time impacts your win rate.
Alright, so you’ve analyzed the data, and hopefully gained some valuable insights. But how do you actually use this hard-won knowledge to improve your sales process?
Consider the following example:
Let's say that data in the age graph tells you that you win the majority of your deals within 2–3 months. You occasionally win even after 4 months, but if a project runs for much longer than that, your win rate is practically non-existent.
In this scenario, you'd want to make sure you (or your team members) are aware of sales projects reaching the 3-month mark, so you'd set a blue "coaching advice" alert to trigger at 3 months, a "yellow flag" at 4 months, and a serious "red flag" warning at 4–5 months.
For more complex scenarios, you could also combine process rules with automated events.