Top 5 eye-opening Graphs for Products

Update on January 17, 2019 by Brenda McDonald

We are super excited about Membrain's new Products feature which was recently launched with great anticipation. "Products" offers a solid database where the services, products or offerings you have as a company can be managed and tracked, along with their unique pricing structures.

Furthermore, when we take Products and combine it with Membrain's intuitive Dashboards - the reporting possibilities are no less than spectacular.

Already we've seen some impressive use-case scenarios out there, with all kinds of creative ways to show, segment and sort data, and display them in full-colour charts and graphs. So I thought I'd share with you a Top 5 list of the most powerful dashboard graphs we've seen so far.

Check out these examples on how you can use Products and Dashboards to get detailed and insightful reports on what's making your business thrive.


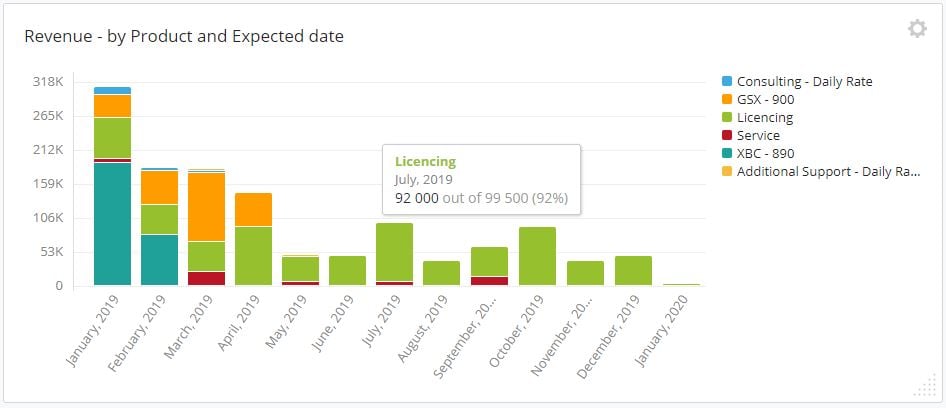
1. Revenue by Product and Expected date

This forecast graph shows us when we can expect to see revenue coming in, and from which Products. Hovering over each section in the graph gives you additional insight into your graphs. Interesting to see Licencing (a recurring cost) is making up most of the revenue in the later months of the year, with almost no new sales forecasted.
Revenue by Product and Expected date

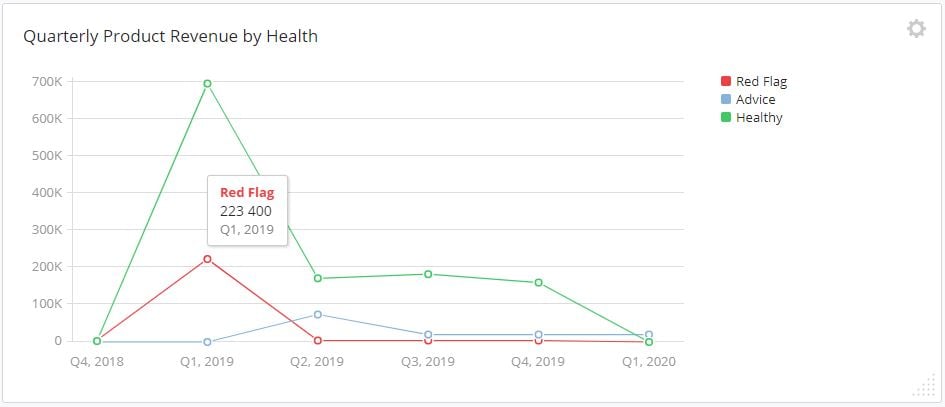
2. Quarterly Product Revenue by Sales Project health

Not all deals will be won, so looking at the health of the pipeline, as well as the expected revenue is a wise move. Here we see quite a large chunk of Q1's expected revenue is showing as unhealthy with red flag warnings. Time to take some action and save these projects before they fall out of the pipeline.
Quarterly Product revenue by health

3. Revenue from Products by your own Custom Fields

Want to see some figures based on your own process? No problem. Being able to incorporate your own Custom Fields into these reports is eye-opening. See revenue by Industry, Source, Partner or any other specific datapoint you track in your business. Here we see the Telecoms Industry makes up 20% of all sales for GSX-900s.
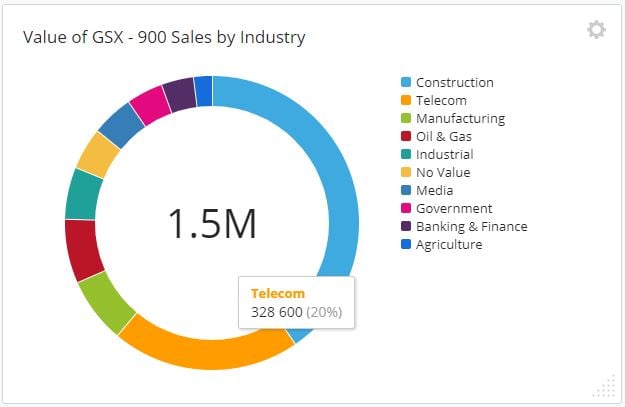
Value of GSX sales by industry

4. Value by Sales Project owner & Product 

This graph is a great way to see who in your team is bringing in the most revenue, while at the same time, show which Products are attributing to that total. Here we see Margo Robbie sold 72k worth of GSX-900's, making up 42% of her total sales.
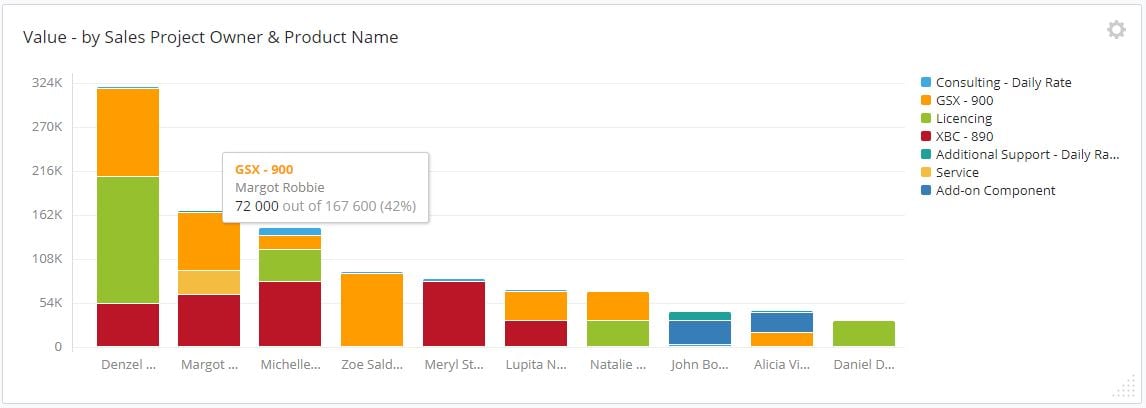
Dashboard Value by owner and product

5. Value by Product and Sales Project Owner - This is, in fact, the exact same graph, just flipped on its head to give you a totally different angle to whats in the Pipeline, and who's put it there. Here, we see Product Value by Product Name and segmented by Sales Project Owner. Just two mouse clicks gives you a fresh perspective on the same data set. When we look at Margo Robbie in this graph, we see her 72k of GSX's, and also that this is 19% of the total revenue coming in from GSX sales.
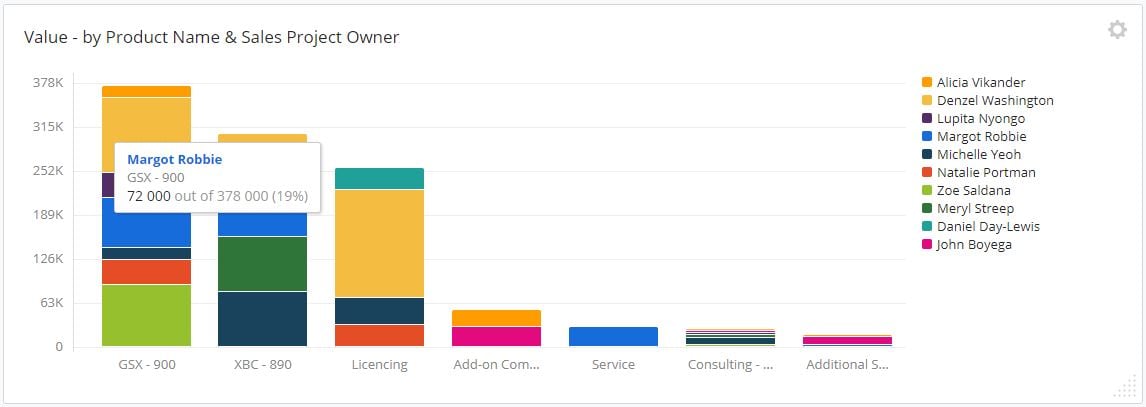
Dashboard Value by product and owner-2


These graphs are just the tip of the iceberg when it comes to what you can do with all the data you have about Sales Projects, Companies and your Team - and now using the new angle Products brings. 

Ready to build your own customized Revenue Dashboard? Great! Let us know if you would like a personalised walkthrough of how you can use Products with The Dashboard to improve your reporting and revenue forecasting.

Or take a look at the Products and Dashboard help center articles to get started today!


Increase productivity with 1 click Follow-Up Tasks

Update on January 10, 2019 by Brenda McDonald

Good Task Management is at the heart of any highly productive Salesperson. And in this day and age, we all strive towards increased productivity, even if that means simply getting to the bottom of a never-ending to-do list.

Membrain's Tasks helps you banish the mundane and streamline task management, allowing you to create, manage and complete your tasks efficiently.

In a small but nifty addition to Tasks we've enhanced the process even further - adding the ability to Create a Follow-Up Task easily while creating Appointments, Notes, and Phonecalls. A new related task is created with one click and set for the next day, keeping you focused on what's required to keep up momentum and get the job done successfully.

Creating follow-up tasks as a reminder to do something important couldn't be any easierCreate and Follow-up

Task Management Highlights

Haven't used Tasks in Membrain yet? Keep track of what's important and don't let anything fall through the cracks. Here are just a few ways you can use Tasks for success:

  • Hit the letter t on your keyboard for quick access to your Task List
  • View your colleagues Tasks List, and comment on their tasks for effortless collaboration
  • Assign tasks to your colleague's (and even contacts outside of Membrain), helping you delegate and spread the load
  • Set reminders for yourself when a task is upcoming or overdue, and flag them so you don't miss any high priority tasks
  • Trigger new task creation automatically from the Sales Process when an event occurs, like a new sales project created, red flag alert or a step is completed, and have it assigned to the relevant person or role.
  • And now! create follow up tasks with one click when creating Appointments, Notes and Phone calls.

So what are you waiting for? Learn more about Membrain's Task and Activity Managagement tools and increase you and your team's productivity now.

New feature! Products - revenue tracking at its finest

Update on January 2, 2019 by Brenda McDonald

Complex B2B sales is just that. Complex. And our mission here at Membrain is to minimize that complexity and make managing opportunities - and all the components that come with them - a more productive experience.

We've added a new feature we're calling "Products" to Membrain's array of capabilities, allowing you to itemize the individual components that make up a complete Sales Project. Whether that's a list of products you sell, different contracts you manage or even simply payments you want to keep track of - all of these can be tracked individually, along with their revenue details, opening up a whole new world of data analysis and reporting possibilities. 

Itemizing the components of a Sales Project is, of course, a great way to manage opportunities and identify which products or services are working for you as a business. But that's just the beginning.

With Membrain's new Product Database, you can capture more specific information on each item, such as future milestone payments, different payment terms, or fixed or recurring costs. This allows for more in-depth reporting and accurate forecasting on expected revenue - not just closing dates.

Here are just a few ways Membrain's Product Database can
add depth to your opportunity management

Products example


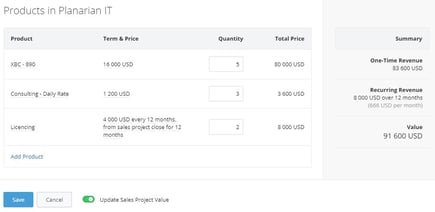
Break down the details of each Sales Project, item by item, with a helpful summary of the overall expected revenue.


dashboard Products graph


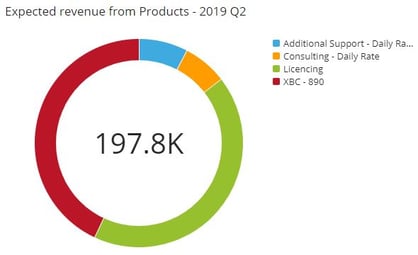
Use Dashboard to create a multitude of powerful graphs about Products, related revenue and other insights. 


We're excited to bring this new feature to you, and hope you are keen to learn more. Get started with Products today with our step-by-step guides, or contact us for a personalized walk-through at support@membrain.com


Currency Fields - tracking monetary value

Update on December 12, 2018 by Brenda McDonald

Recording the value of a sales project is, of course, how we track incoming revenue and forcast effectively. Though its often necessary to track other metrics which have a value associated to them, over and above the sales project value. This is where Currency fields come in to the picture.

The newest edition to Membrains collection of custom fields - Currency Fields - are now available.

Option to create a Currency Field

So whats a Currency Field I hear you ask. Well, Currency Fields allow you to track an item, service or product you're offering and see its value in monetary terms


With this new field type comes the ability to record not just the overall value of a Sales Project, but to get more specific and track the value of individual items, quantified in monetary value. Not to mention the multitude of new possibilities for analysing this data to get real insights into where your revenue is coming from, right down to a granular level.

Currency field in Dashboard 2   

Currency Fields are fully incorporated throughout Membrain, and can be used in lots of ways including:

  • Filter, group and sort the Sales Project List view to clearly see your new Currency Fields at work
  • Use them with Calculation fields and let Membrain work out margins, percentages, discounts etc of individual value items, regardless of your personal currency settings
  • Include them in your favourite graphs in a Dashboard, to see where your revenue is coming from in full glorious color

Want to know more about Currency Fields?  Great!  Get started with this help center article that walks you through setting up Currency Fields


Comments and mentions now in more places throughout Membrain

Update on December 6, 2018 by Brenda McDonald

Communication and collaboration is at the heart of any good sales team. The more we share our knowledge, offer advice or give encouragement, the stronger and more successful we become.    

Membrain makes this easy with the use of Comments and Mentions, keeping the conversation active with the relevant people on the team and in correct context.   

Previously, Commenting on items or events and Mentioning colleagues (using the @ sign followed by their name) were only possible in the Activity Stream of a Sales Project, Prospect, Company or Contact. But with this most recent update, it is now possible to use Comments and Mentions in Tasks and Appointments too! So you can keep the conversation relevant to where you are, and what you're working on.

Mention Activity Stream

Some scenarios where this update helps your team work collaborate and communicate:

  • Before you invite your colleague along to a meeting, why not Comment on the appointment itself, Mention your colleague and ask if they want to join in? 
  • Ask a team member how a meeting went and follow-up from the appointment itself
  • Let your manager know you need some assistance on a Task you've been assigned to, just mention him/her in the Task and keep the conversation relevant  
  • Or even ask a colleage for a status update, on those tasks that you've assigned

And whats great about these comments and mentions? You guessed it, once you mention someone in Membrain, they get an instant notification in Membrain Guide. So you can grab their attention right when you need it. And whatsmore, they work with Membrain Go, our mobile app.  

Learn more about how Comments and Mentions in Membrain can help you build team work with your colleagues today!


Integrate to Slack and improve team communication

Update on November 29, 2018 by Brenda McDonald

What do you get when you cross the best Sales Effectiveness Plaform on the planet with a growing Communication and Collaboration app?  You guessed it... the much anticipated Membrain - Slack integration!

Use the Slack Integration to Alert, Inform and Encourage your teams about all the important milestones reached in Membrain, as they happen!

slack logo-1

We're very excited to launch Membrain's most recent integration, keeping everyone in the loop on the exciting things that happen within Membrain.

Let Membrain send notifications right throughout your organisation via your chosen Slack Channel, and keep everyone updated!

A few ideas to get started with the Slack Integration:

  • Send a congratulatory update to colleagues when a Sales Project has been won!
  • Notify the Finance channel when an "Agreement Signed" step in a Sales Project is completed
  • Alert the Customer Support channel when a Sales Project generates a red flag
  • Inform the Marketing channel when a "Demo required" step in the Sales Project is completed
  • Notify the Sales channel when a Prospect has been converted to a Sales Project

Can you think of any other ways where you could use this powerful integration? Get creative and spread the word with your colleagues through this easy to set up integration today! 

Learn how with these help center articles: Slack Integration Setup and Automated Events in Prospecting and Sales Projects.


Improved Graphs for Win/Loss Analysis

Update on November 28, 2018 by Brenda McDonald

Membrains Win/Loss Analysis features provide you with the insight you need to understand which deals you win or lose, and most importantly why.

But thats not all - these graphs are jam packed with additional details, helping you pinpoint behaviors and trends in your process, like how sales projects move through the pipeline, what parameters indicates a strong opportunity v's a weak one and much more. 

Improved visualisation of Win/Loss graphs helps you understand your data and see trends clearly

Historically, data with extreme outliers in numerical fields, or in time related data-points meant useful data sometimes got squashed into one area of the graph, making it difficult to clearly see the most important (and often data-rich) bulk of information.

Win Loss Value of Services

Grouping these outliers with extreme values on both ends of the spectrum gives additional definition to the most relevant data, allowing you to gain that visual understanding of your data at a glance.  

Learn more about Win/Loss Analysis in Membrain, and start using these powerful graphs today!

New insights for "Time spent in stage"

Update on November 22, 2018 by Brenda McDonald

Sales Cycle Length is a hot topic in B2B sales, and its no wonder! Shorter sales cycles generally lead to greater profits, since more deals are being closed faster.

It therefore makes sense to identify those Sales Projects which have stalled or are spending too much time in one Stage of the Sales Cycle, as they could spell trouble. To help you see these trends in real time we've added new functionality throughout Membrain to allow you to dig deeper into this metric, and see how long Sales Projects are spending at each Stage of the Process.

There are lots of different ways you can use this metric to show you how fluid your Sales Pipeline is, and how it flows through your process. For example:

In the Dashboard:

Show Sales Projects which have spent the most Time in their current stage, and sort by longest to shortest time.Time in Stage Graph final

Create a graph showing all current and historical Sales Projects and their average time spent in each stage of the process, shown by status Open, Archived or Won.
Average Time in Stage - By Status

This data can also be used in other areas of Membrain, for example:
  • In the Active Pipeline - Sort open Sales Projects by Time in Current Stage, and see them grouped in each Stage.
  • In the Sales Project List view - drill right down to see the date they entered any of the specific stages in the pipeline, as well as the time in that stage.
  • Export this data out to excel for use outside of Membrain


We hope you like this new functionality - give it a try today and see how it can help you gain additional insights into your sales life cycle.

Dashboard - new sorting and color coding options!

Update on November 15, 2018 by Brenda McDonald

Membrains Dashboards allow you to create powerful graphs and charts - fully tailored and customizable to your business, stragety and key metrics. 

And we understand you want full control over how you visualize your data. So we've made some improvements to help these dashboards become even more visual, to help you spot trends and see vital information at a glance.

Learn how Dashboards can give you more insight into your Sales efforts today!

Sorting Values

New options allow you to change the order information in the graphs you create, so you can view values not just alphabetically, but in other ways that make more sense to the data in the graph itself.

So now you can quickly sort By Value (largest to smallest, and vice versa), and also By Direction Dates, Stages, Health, Status and even custom field values.

Sort by Value largest down Dashboard

Probability Color Scale

A new color scale helps you visualize how probability is distributed across the pipeline, spanning from a "weaker" color to a “stronger, more positive” color as probability increases.

Take a fresh look at the value of the pipeline and see at a glance how that relates to their probability.

Value scale dashboard


New Pricing Structure with a Powerful Module-Based Approach

Update on November 8, 2018 by Brenda McDonald

Membrain is proud to announce a brand new Pricing Structure, offering a powerful module-based approach to our new and existing customers. 

This new flexible design, allows you to complement the main Membrain platform with the additional modules that you need - all easily accessible from inside Membrain's beautiful and easy to use software.

Customize Membrain with add-on modules that fit your specific process and needs

HERE'S HOW IT WORKS:

Start with the Core Platform - capabilities include a customizable Sales Process, CRM Database, Sales Performance Management, Membrain Guide and the mobile app Membrain Go, plus much much more.

Add the Modules you need - Dynamic Process Tools | Prospecting Campaigns | Sales Analytics + | The Content Hub to suit your specific business and process needs.

Select how many accounts you need - Full users and/or CRM users. We understand that not everyone on the team needs all the powerful capabilities of Membrain. Add CRM users and include the rest of the organization in your sales efforts.

Want to learn more?  Head over to our website and find out how a customized Membrain Package could look for you. Or contact billing@membrain.com and we'll walk you through all the options available.


The Content Hub and New Pricing Structure go hand in hand

Can't wait to get your hands on The Content Hub for your team? Great! Move over to the new pricing structure before December 21st and take advantage of a special introductory offer you won't want to miss!


More updates to Membrain