Popular Content
Membrain for:
All sales organizations organically collect data, whether specifically entered by salespeople, or automatically by using the capabilities built-in to the software.
Membrain's Dashboard capabilities add creativity and flexibility regarding how to work with that data to turn it into actionable insights.
The dashboard is the place where you can use virtually any data you can imagine from Membrain and create stunning visualizations. These can help drive strategic initiatives, help you hone down on specific parts of your sales process, or act as an entirely new daily starting point for sales leaders in Membrain.
This view is incredibly flexible and easy to use, and you can create several dashboards, each with a specific objective in mind.
What's more, the graphs that you see in the Performance View can be recreated in the Dashboard and configured how you like it, allowing you access to all the analysis and reporting capabilities Membrain has to offer from one central point.
Dashboard Example:
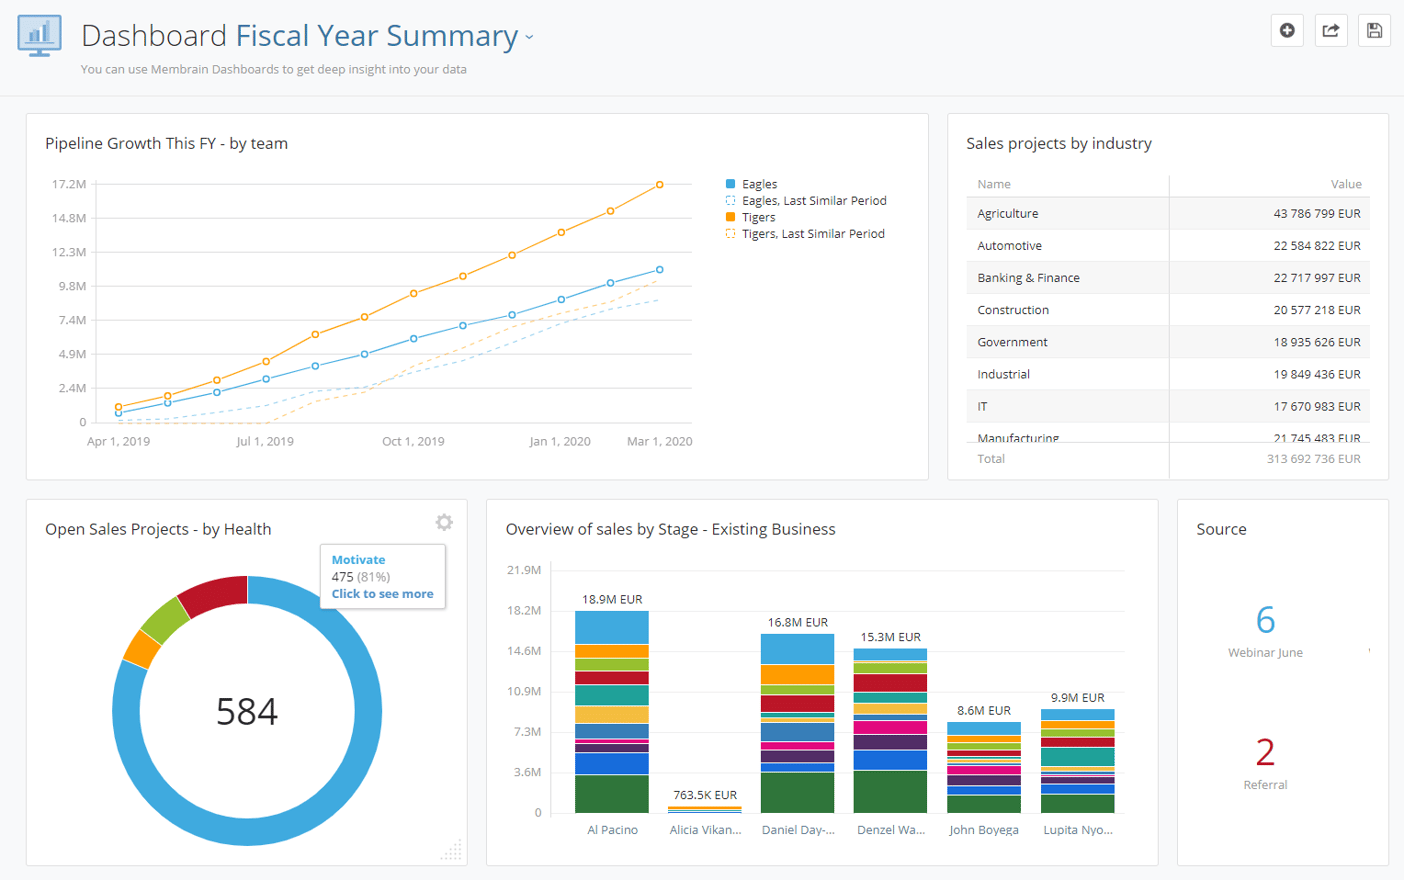
In Membrain, you can easily share your dashboards with colleagues, fostering collaboration and ensuring everyone is on the same page. To share a dashboard, locate the "Share" button in the three-dots menu.
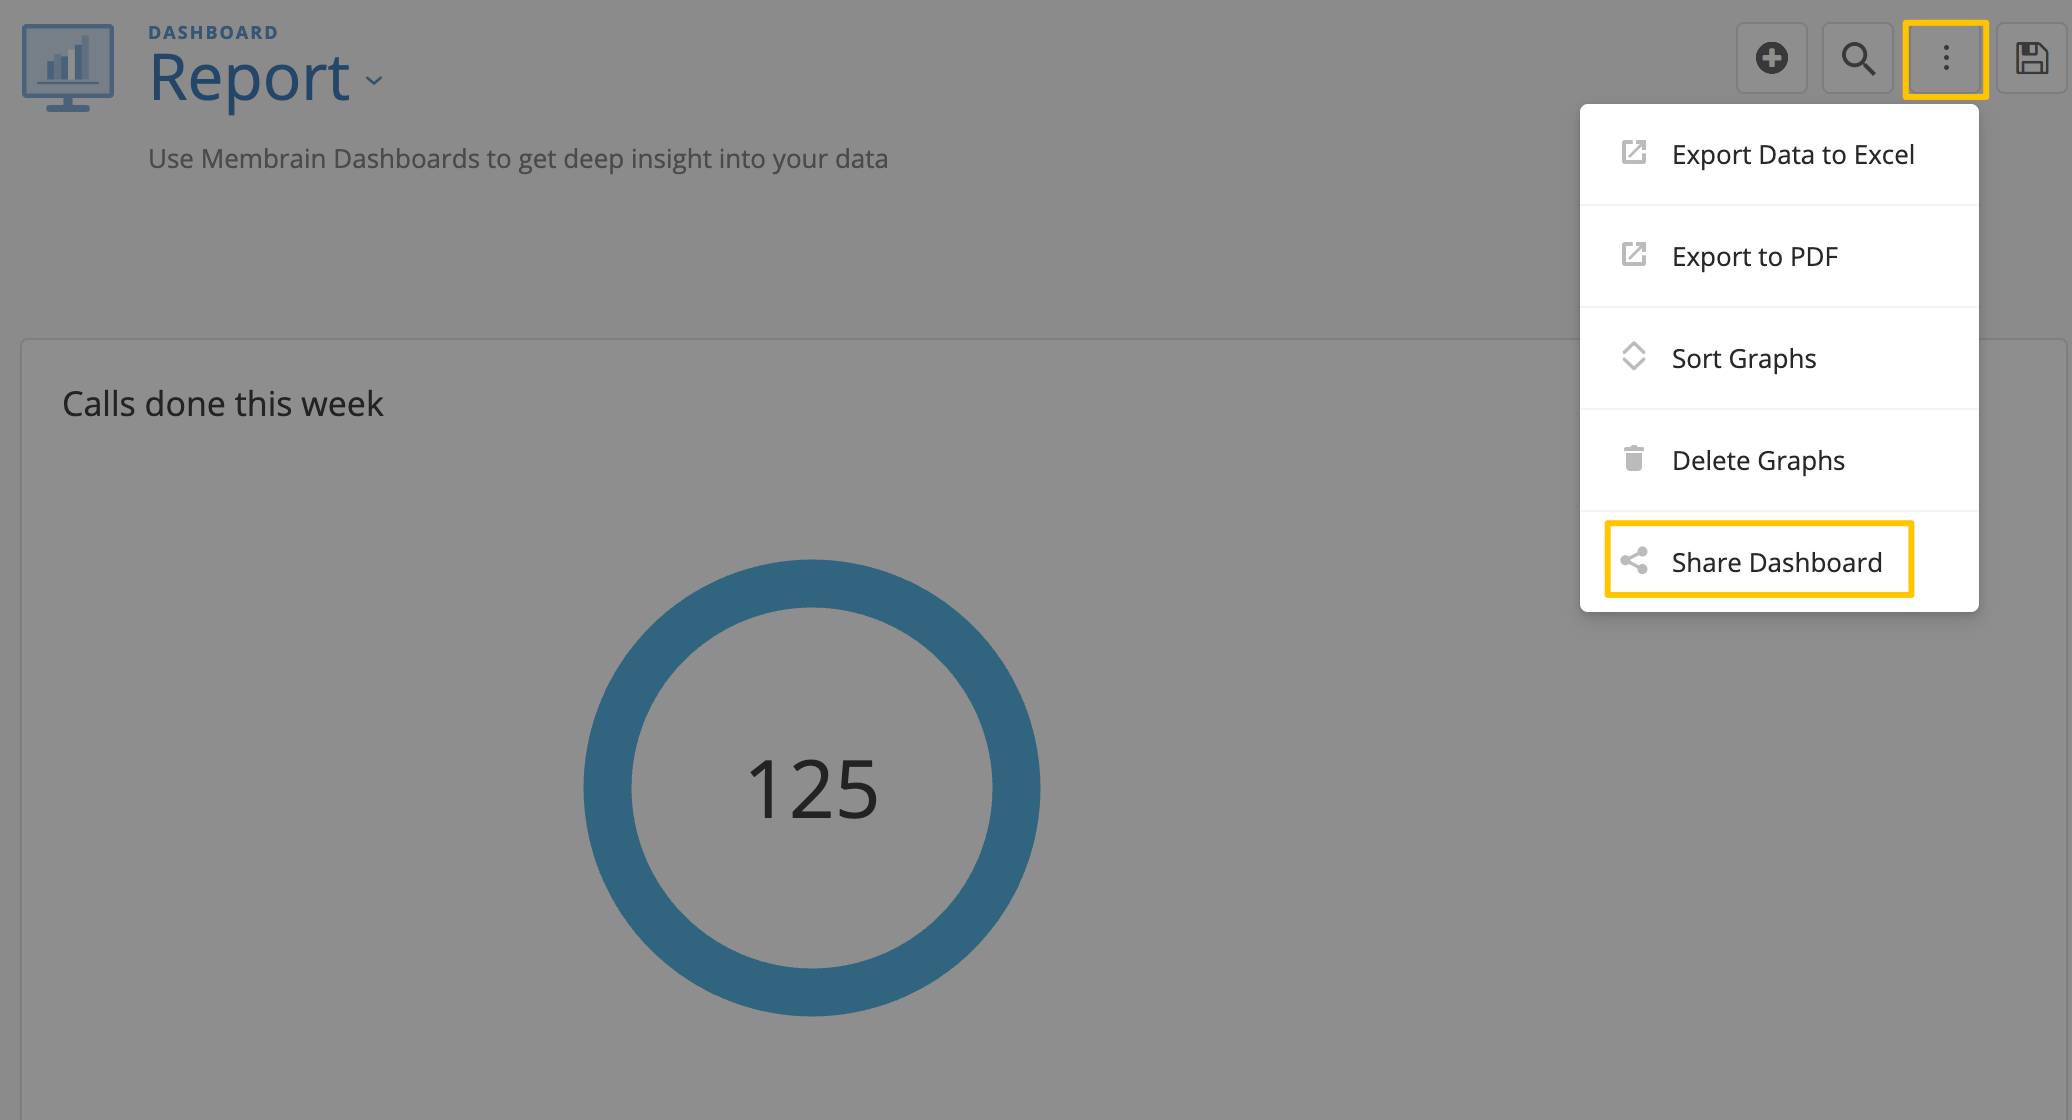
This button will generate a link that can be shared for this view. Keep in mind, the "Share" button will be available only if there are no unsaved changes on the Dashboard. When sharing, it's essential to consider permissions: if a colleague has the necessary permissions to access a shared Dashboard they'll see the content as intended. Otherwise, an error page will inform them of the access restriction.
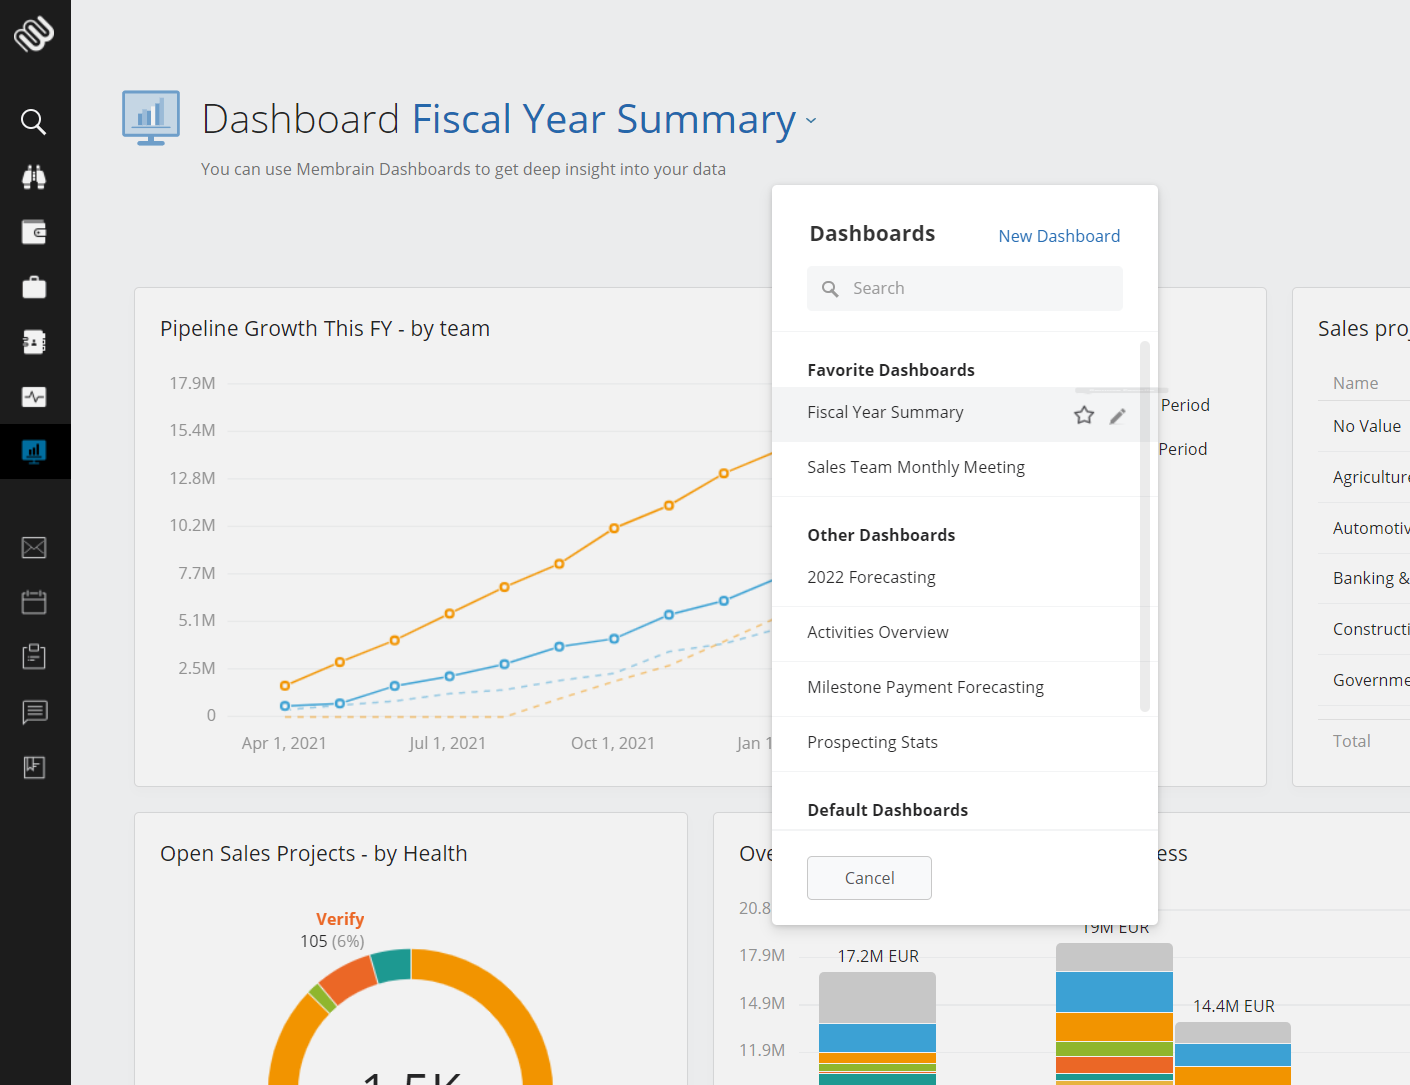
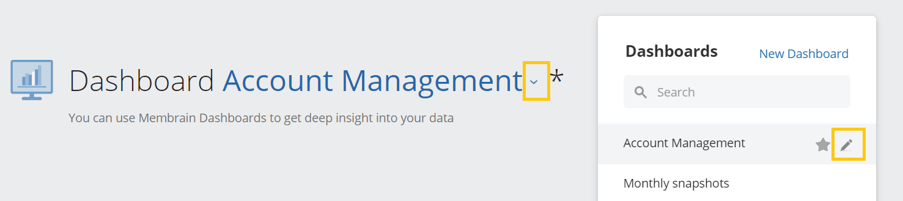
You can create various Dashboards with a different focus, depending on how you want to analyze your data. For example; a Dashboard for each business unit, or perhaps for each Region or Territory, or even a Dashboard to guide you through a Team Meeting. It's totally up to you how you want to structure your Dashboards.
You can favorite your most used Dashboards by clicking on the star icon at the right of the name of the specific dashboard you like to highlight.
Membrain provides a gallery of pre-built and pre-formatted graphs. These are specific graphs using your data and available to you across the four workflows - Prospects, Sales Projects, Account Growth Projects and Tickets as well as all other areas of Membrain, including Company, Contacts, Activities, Product Revenue, Performance, Users and Form Submissions.
Graphs can be added to your dashboard with one click as they are, or they can be further edited to include specific criteria you want to see.
Within the Dashboard, you can find the Graph Gallery when you click on "Add Graph". From here, you have the option to create a new custom graph or select a any of our many recommended pre-built graph from the gallery and make any appropriate adjustments from there.
Use the search option to find a specific graph from the list 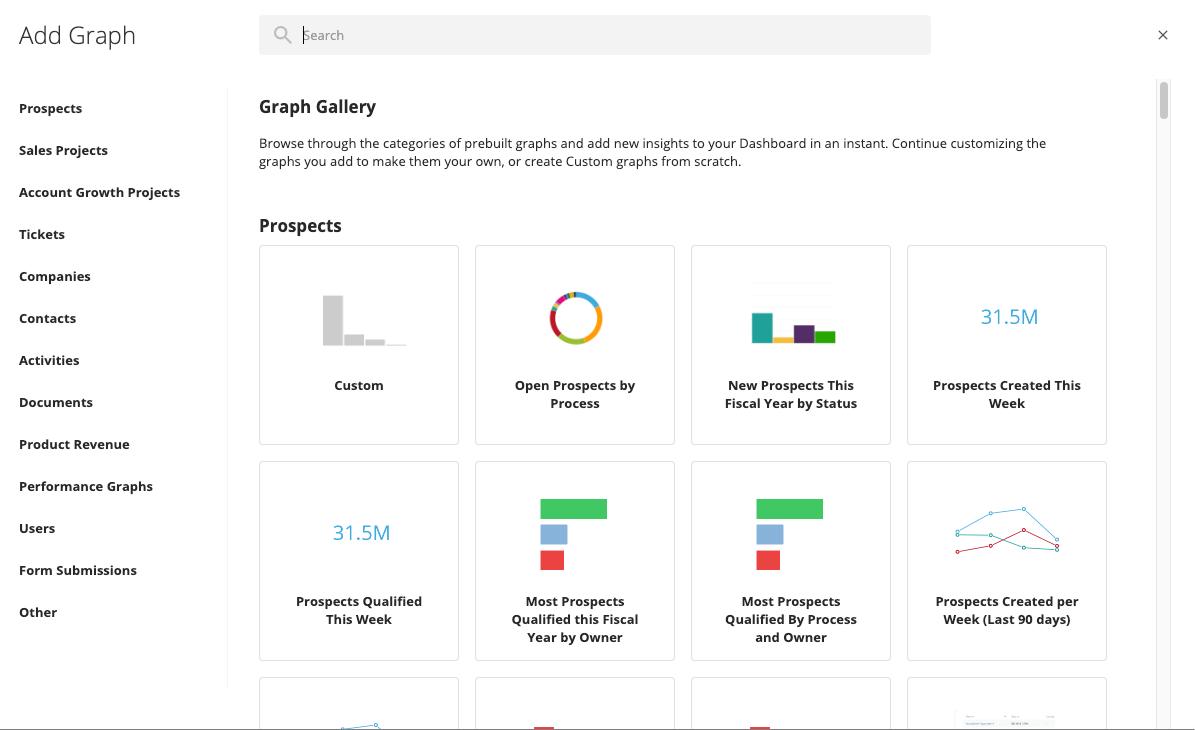
Once you find a graph that you want to include in your Dashboard, simply select it and click save and the graph will be added to your dashboard.
Once you've added a graph, you have the option to continue configuring to make it your own, by hovering and clicking on the cogwheel icon, at the top right of the graph. Read this article to learn more about Building Graphs in Dashboard.
Dashboards hold valuable insights, that perhaps others on the team would benefit from seeing. You may want to share a Dashboard with a particular team, or with the whole organization. Or perhaps limit the access of a certain dashboard just to the Management team.
Change who has access to a dashboard by editing the Viewable By and Editable By settings on each individual Dashboard.

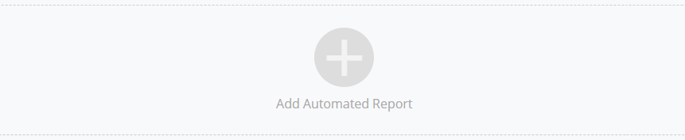
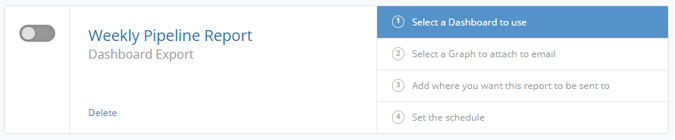
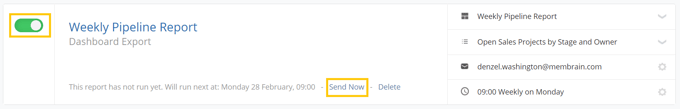
You can subscribe to a dashboard to have it sent to you via email, on a specified schedule. This can be done by users with administrative rights.
You can track, and report on your company's data in real-time with the help of interactive data visualizations, like your TV screen or other tools. To create a live dashboard:

A link will be provided so that you can display your key business metrics in real-time and make them available via a multitude of other tools, devices, or platforms across the business so that your team members are able to visualize their productivity and targets at any time.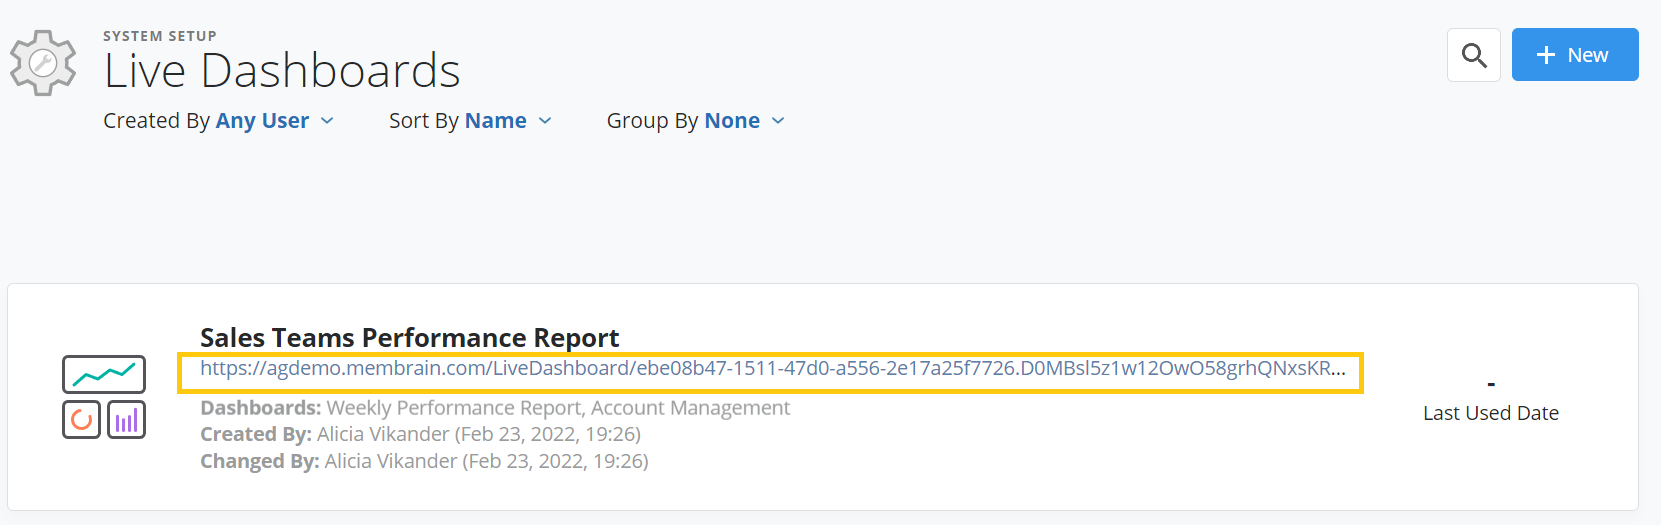
Membrain takes the security of your data seriously. With Live Dashboards, you have the power to control access in various ways:
Password Protection: You can set up a password for a Live Dashboard, ensuring that anyone with the access URL must enter the correct password to view it. It adds an extra layer of security, making your information accessible only to those who have authorization.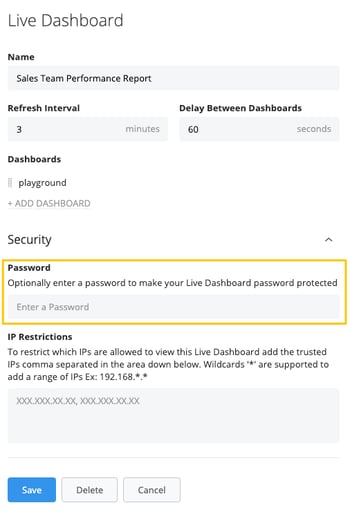
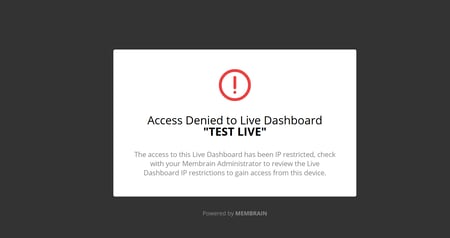
IP Restriction: IP Restriction is another robust security feature that you can apply to your Live Dashboards. By whitelisting specific IP addresses, you make sure that only devices with these IP addresses can access the Live Dashboard. Any attempt from a non-whitelisted IP will result in an "Access Denied" warning.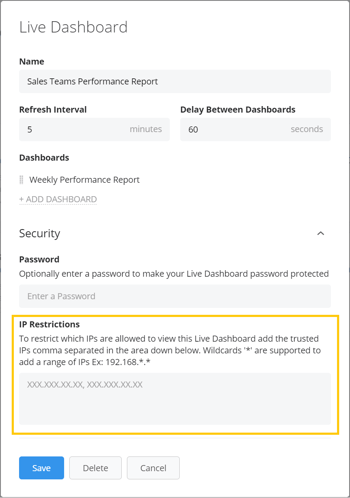
You can export the data from your dashboard for additional analysis, import it into another system, or add it to a PowerPoint presentation or similar or outside Membrain. Simply click on the Export icon (top right) and choose to export to PDF or to Excel.
Select this option to see all the data from each graph displayed in an Excel spreadsheet. Each graph of data is represented in a separate sheet in the Excel file created.
Select this option to export the dashboard to a PDF file.
Clicking on either of the above options will download the .xls file or .pdf file, ready for you to open or save to your computer.