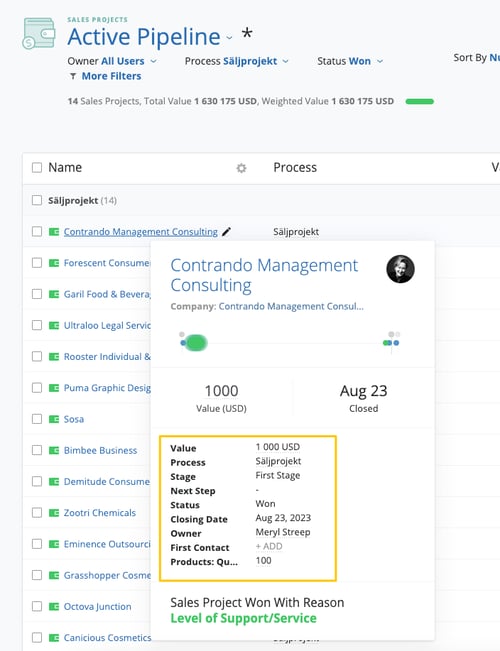
When you hover over the name of a Sales Project, Prospect, or Account Growth Project, you see additional information in a preview dialog. This is a great way to get more insights right from the view you're in, without having to click through. This is true for the Active Pipeline view, List views, and in other areas like the Company Page, Dashboard Graph drill-downs, and even in Win/Loss Analysis Views.
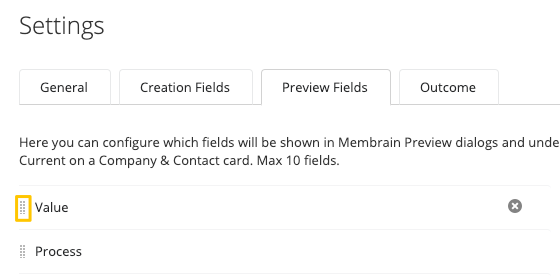
It is possible to configure this preview dialog and customize it to show the information that is important to your organization. Add the standard and/or custom fields you want to show, and rearrange them in the order of your liking!
Administrators can, from the Process Editor, set up which data fields will be visible when you hover over Prospects, Sales Projects or Account Growth Projects in various areas throughout Membrain.

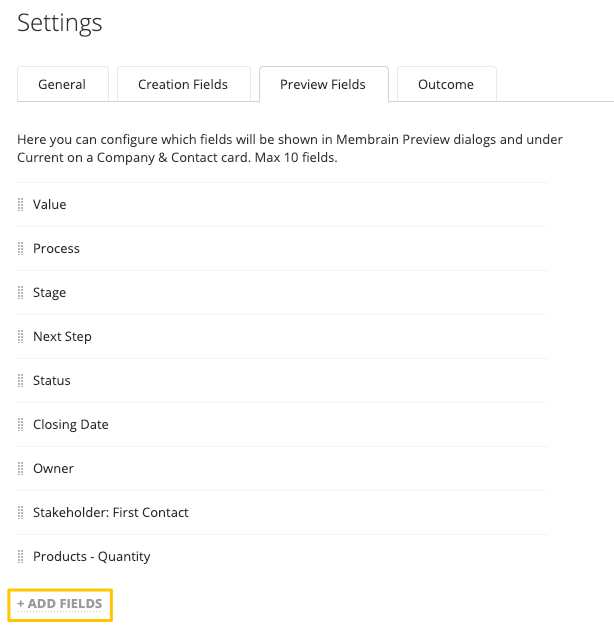
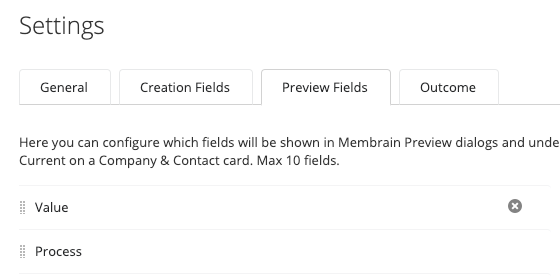
Keep in mind that Preview Settings are Process specific, meaning that you can customize different preview settings from one process to another, giving you lots of control over how these previews look like.
Hovers are now customized to your liking, and visible in various the Active Pipeline view, List views, and in other areas like the Company Page, Dashboard Graph drill-downs, and even in Win/Loss Analysis Views.
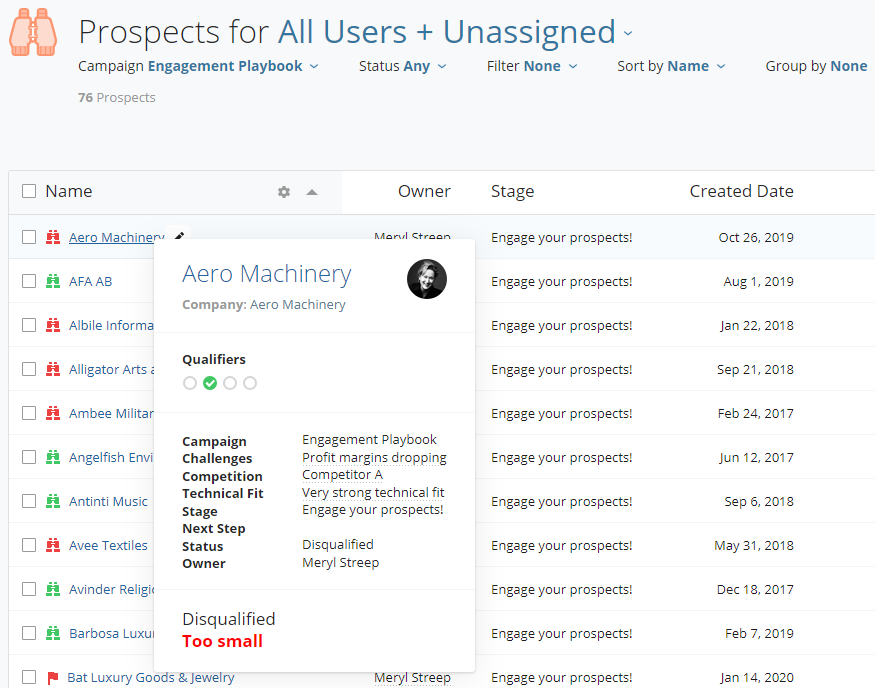
Hover to see additional information.