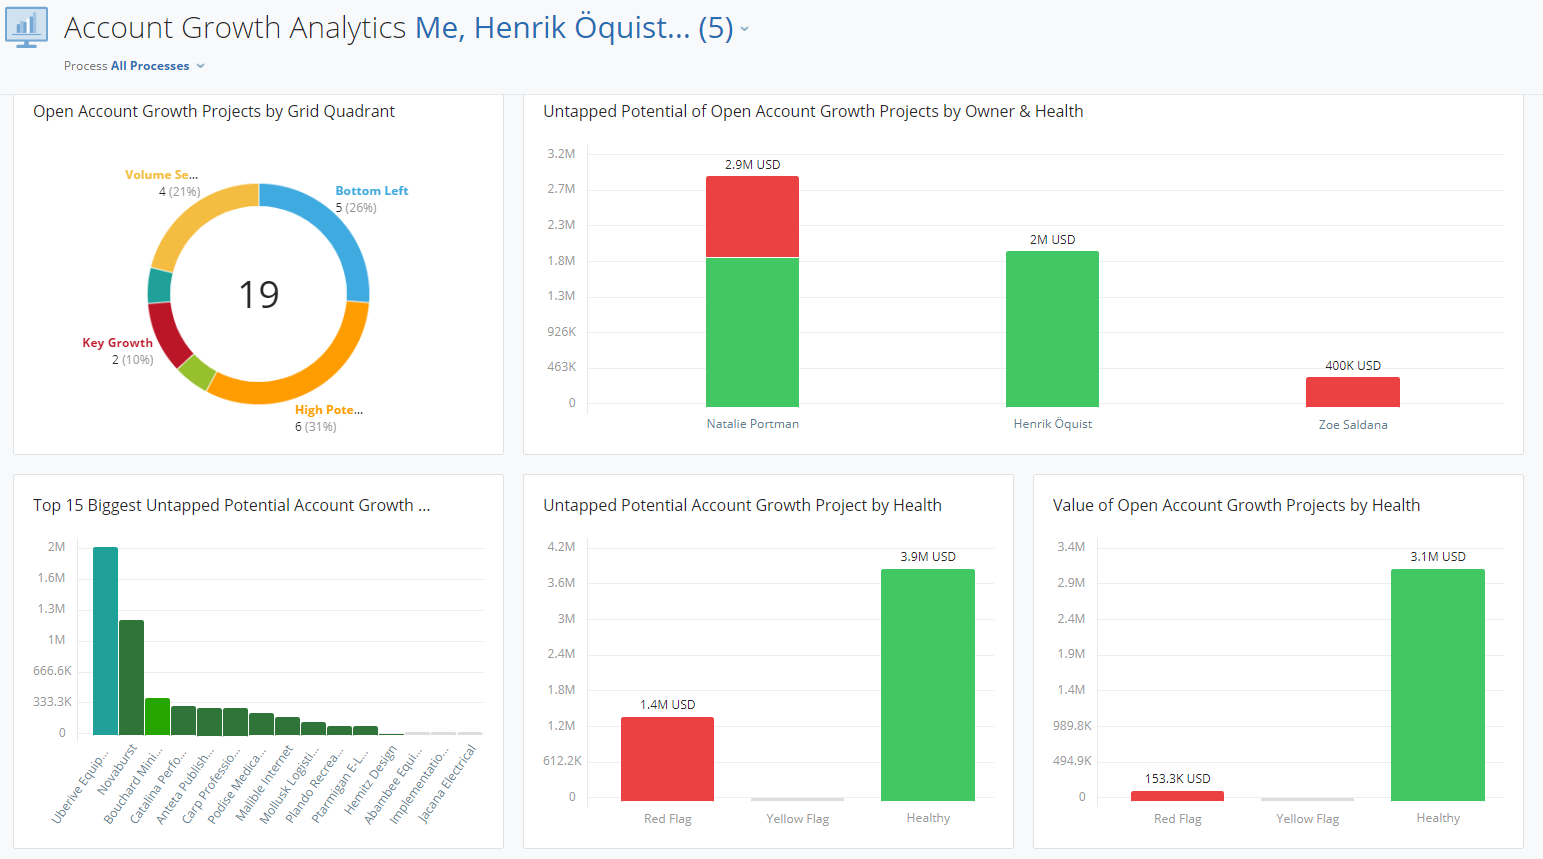
Because Account Growth reports can be created by pulling in data from lots of areas in Membrain, this gives you the opportunity to create stunning visual graphs.
Account growth Analytics provides visibility to your sales project data in real-time, enabling proactive strategy adjustments. The analytics include a set of pre-defined and pre-formatted reports using your existing Account Growth Project data.
Two settings are available that you can change to see exactly what you want:
This allows you to select which people you want to see in the view. You can select all, one or more teams or one or more individuals. You can mix and match to easily create specific views of the data that you need. This list will automatically show all the people who have a sales project in the Account Growth Projects.
The process selector allows you to select one or more processes. When selecting multiple processes the graphs will sum the results to show the total (or in some cases, average) of those processes.
You can find Account Growth Analytics from the Main Membrain Menu, under Sales Analytics. Click on the Sales Analysis icon and select Account Growth Analytics.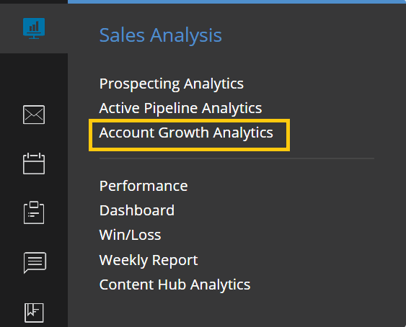
Account Growth Analytics holds valuable insights, that perhaps others on the team would benefit from seeing. You may want to share these analytics with a particular team, or with the whole organization.
An Administrator can change who has access to view Account Growth Analytics by giving permission for all users or specific teams access.


From north to south, east to west, Membrain has thousands of happy clients all over the world.