Account Growth graphs can be created by pulling in data from lots of areas in Membrain. This gives you the opportunity to create stunning visual graphs that cover a range of different data points from various angles of Membrain. You can configure and interactively create, modify graphs, and change the type of graph at any time. You can build your graph pulling data from the following data types:
- Activities
- Prospects
- Sales Projects
- Product Revenue
- Account Growth Projects
- Tickets
- Contacts
- Documents
Getting Started
In Account Growth, you find the Graph component within the Account Growth Process editor.
- Go to System Setup

- Go the Account Growth Process
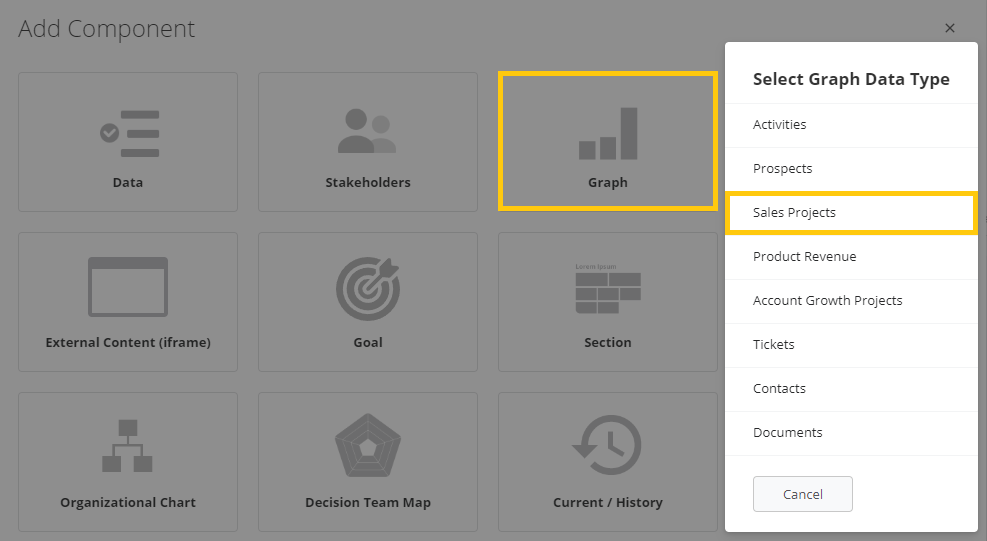
- Click on Add Component and find the Graph icon
- Select Graph Data Type
- Configurate your Graph now or return to this later by clicking the Cog on the top right corner to configure the graph

Graph Configuration
Configuring the data you want to show in your graph is easy!
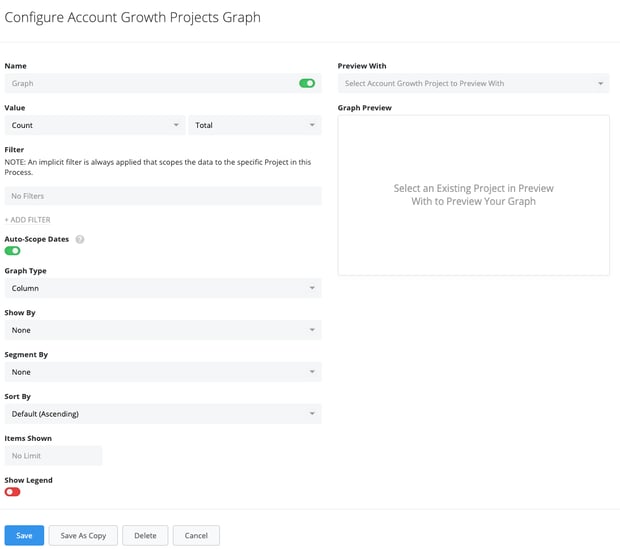
- Name - give your graph a descriptive name
- Value - Select what you want to measure the data in your graph on, for example, value, count, days since last activity, time in stage, or any other custom fields you are using in your sales process
- Filter - Select criteria to filter your graph on. This will ensure that the data in your graph is the specific subset of data that you would like to see, based on certain criteria
- Auto-Scope Dates - This feature ensures that by default, graphs will automatically reflect information occurring between the project's Start and End Date. However, if you wish to customize the time span, simply disable this setting to input your preferred criteria in the filter.
- Graph Type - Choose how you would like to Visualize your graph. Select the style of your graph from options such as Donut, Number, Column, Table, Line, Tree map, Bubble, Pie or List graphs type
- Show by - This feature allows you to categorize data on your graph based on certain criteria, such as by team or by project owner, providing a more organized and insightful visualization
- Sort By - Sort the data in order or size you prefer
- Items Shown - This option allows you to limit the results of your graph to give a maximum range. For example Top 5, 10 etc. Enter the value that you want to limit the values in your graph to
- Show legend - Enable this option to display a legend alongside your graph, which will help identify what each colored line or segment represents.
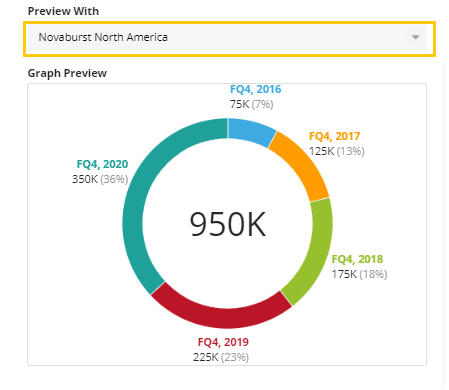
Graph Preview
Inside the Graph configuration layout, you have the option to preview what you built before publishing giving you a visual of what the report will look like in real-time. You can pick the account you would like to preview the data with.
If you want to tailor what type of related items you want your Account Growth Timeline to reflect, other than the related Company of the Account Growth Project, you can change this in the Process Settings. You will find more information about connecting other Prospects, Sales Projects or Account Growth Projects to your Account Growth Process and Timeline in this article.