The Weekly Report is a very popular view for both Sales individuals and Management alike. It provides a visual overview of the size and health of the pipeline, along with up-to-date statistics on performance towards Outcome Goals, Effectiveness Goals & Activity Goals and other metrics.
But what's really great about this view is that (permissions granted) you can view an individual's report, a team's combined report, or a report for all users within your organization. Of course, you can choose which date range to view too, so keeping an eye on trends in you or your team's sales efforts is a breeze.
The weekly report is broken down into 3 specific areas, briefly, these are:
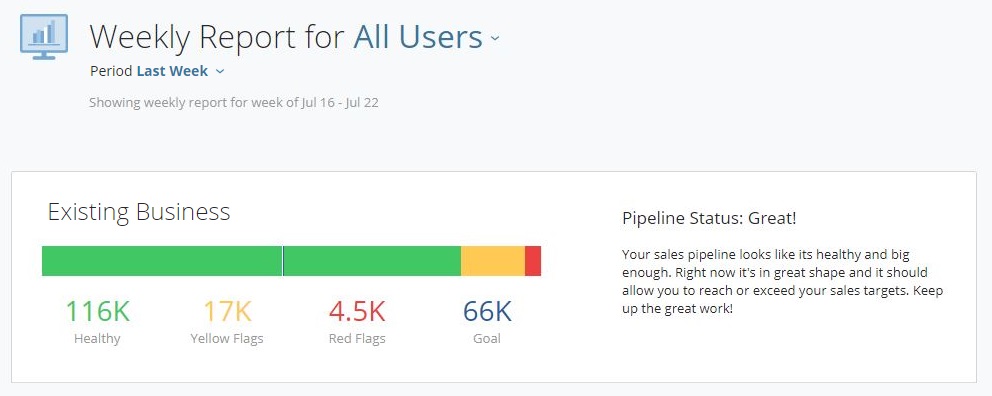
The Pipeline Status is a summary of the size and overall health of the weighted pipeline. In the example below, we see that the pipeline for All Users on this Date Selected has Projects worth 116k which are in a healthy green state. There are Projects worth 17k which have yellow flags associated with them. And finally, we see Projects worth 4.5k which are unhealthy and are showing red flags. We also see that the Sales target goal of 66k is being smashed.

The color-coded status bar helps us visualize the health of the process at a glance by representing these values in green, yellow, red blocks, and we see the sales goal is also represented here as a blue line almost halfway across.
This pipeline is in great shape! And what's a healthy pipeline without some well-earned praise? To the right, we see a short summary, describing how well you're doing or if more work is needed and where.
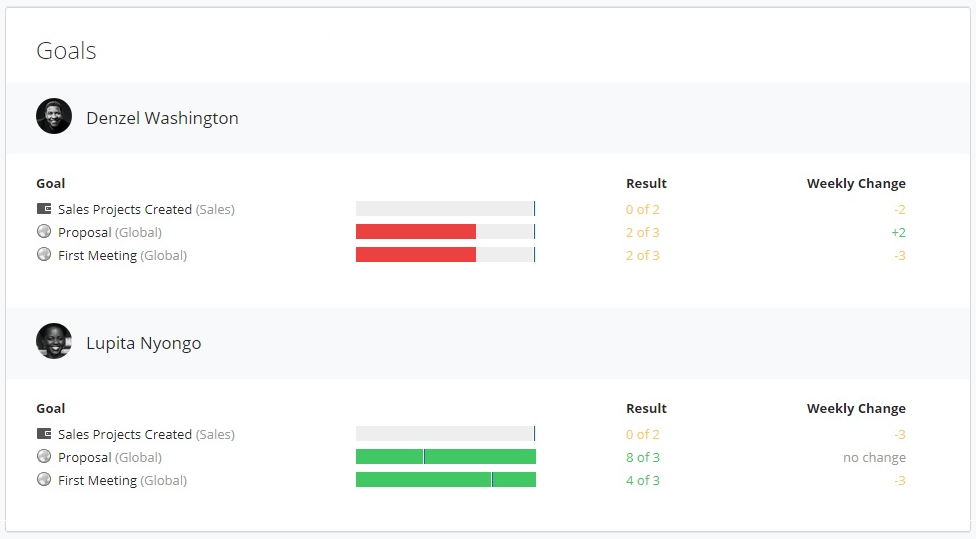
This section shows the performance of all types of goals, providing a comprehensive overview consistent with what is seen in "My Goals". It includes detailed statistics on the number of new projects created, first meetings conducted, or phone calls attempted. Please note that Supporting Goals are not included in this report to maintain focus on the primary objectives.
In the example below, we see Denzel is trailing on his goals so far this week. Though, he may still have time to catch up and reach them by the end of the week. We can see how he's doing compared to his goals, and also how this compares to how he performed last week. On the other hand, Lupita is having a pretty productive week, and did so last week too. Perhaps it's time to review her goals and adjust them according to her ability.
Learn how to create Activity types that are specific to your organization in this help center article.

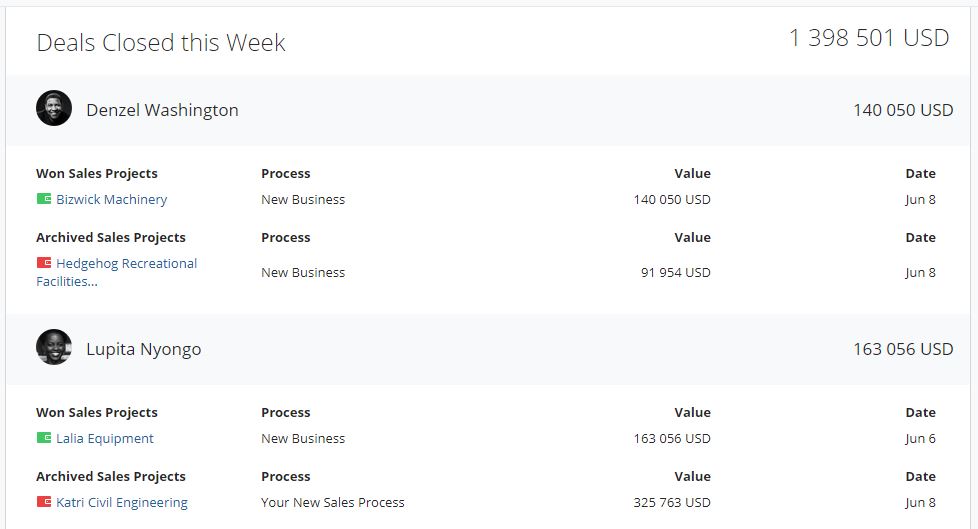
In this last section, we see a breakdown of the deals which have closed this week, listed per user or team member. These may be Sales Projects that have been won, as well as those which were not so successful and have been archived, or lost. A recap of which process the project belonged to, along with the total value of the deal, is also shown.
Depending on the options you've chosen up top for this Weekly Report, you will also see the total Value of all the Won Sales Projects, for the team and/or for the individual sales representative.

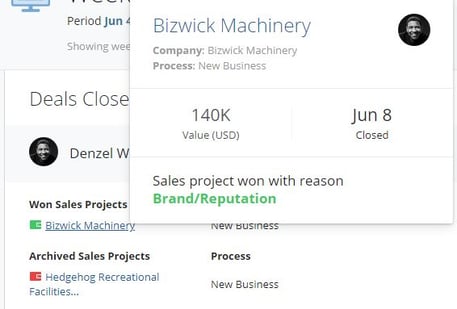
What's very useful here is you can hover over the Sales Project name to get a quick overview of the details and why it was won/archived without having to leave this report.
And for even further details, click on a Sales Project name and follow through into the Project itself. Recap on (or edit) the specifics, including the reason the deal was won/archived, plus any additional info or notes that were added when the deal was closed.
From here, you can also choose how you would like to manage this sales project, now that it's been closed. Further options allow you to change the status of the Sales Project, bring it back into your pipeline, or perhaps go right back to prospecting again.

From north to south, east to west, Membrain has thousands of happy clients all over the world.


