Popular Content
Membrain for:

The data on which the grid is based, is customizable and flexible, allowing you to design the characteristics that determine the value and potential scores of each account.
They’re also dynamic, allowing the grid to change over time as each account’s value and potential changes or as the characteristics on which you base them change.
The overview perspective that you get with the Growth Grid can be viewed from different angles with the help of filters and will always show you the health (green, blue, yellow, or red) of each Account which makes it clearer where to focus.
Based on the present Value and Untapped Potential, your Accounts are divided into predefined quadrants of the grid, giving you a reliable segmentation of your Account portfolio.
From the Process Editor, you can configure the structural settings of the Growth Grid. The settings are to be set up separately for each individual Account Growth Process (and will not be applied if you combine several processes in your Growth Grid view, as described above).
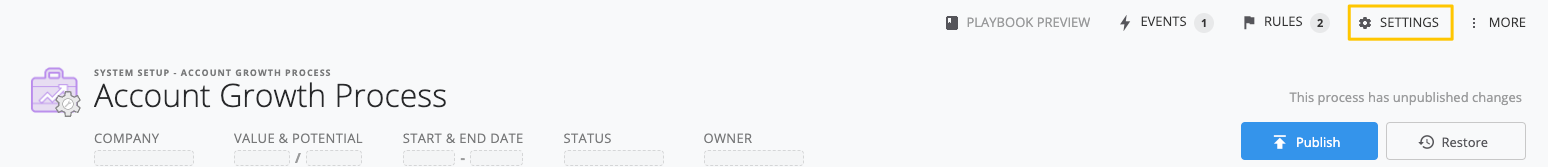
To set up the Growth Grid, you go to the process editor and click on Settings.
From the general tab in Settings, you set up the structure of the Growth Grid which is formed by the names of the four quadrants and the underlying ranges of the Value and Untapped Potential axis.
The quadrants of the Growth Grid will segment your Accounts based on the Value and Untapped Potential based on these parameters:
By default, the names of the quadrants are blank and you can name them after your own liking or according to your organization's approach to segmenting customers. The Growth Grid will segment your Accounts in the quadrants based on the current Value and Untapped Potential and by adding names to the quadrant, the Growth Grid will objectively to the segmentation for you.
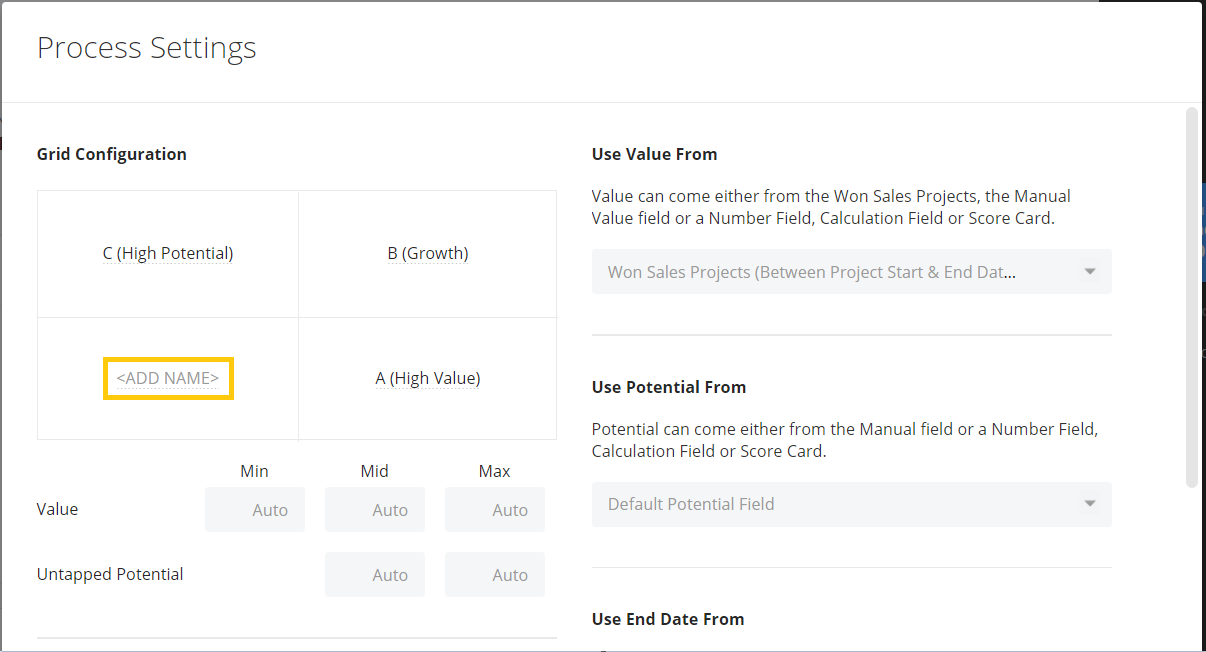
The underlying range of the Value and Untapped Potential axis will determine how the Accounts are positioned in the Growth Grid. This setting lets you decide the Min, Mid, and Max values that the Grid is to use when compressing the Accounts into their position in the Grid.
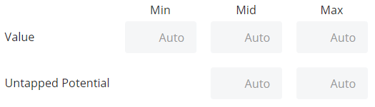
By default the ranges are set to Auto, meaning the Grid will use the Account in the current Process with the lowest Value as the Minimum range, the Account with the highest Value as the Maximum range, and the Mid-range border as the middle value of the other two parameters.
Using Auto for the configuration can for instance mean that if the Value is increased a lot on an Account that already has a very high Value and is positioned furthest to the right, the Grid will automatically use the new highest value as the Max range and compress the overall range. This will essentially mean that the structural layout of the Grid is re-configured by the new highest Value, which in turn will place the other Accounts in your Grid into new positions. See a demonstration in the example below:
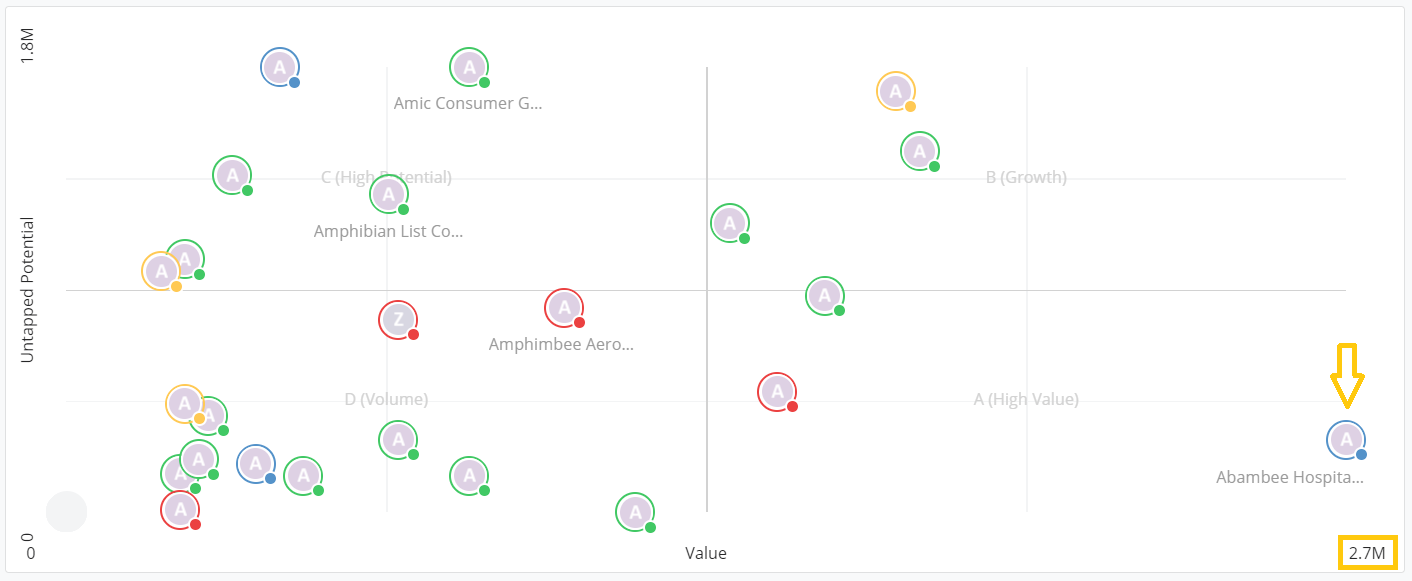
The Min and Max Value and Untapped Potential that are automatically generated according to what has been explained above will appear in the top and bottom left corner, and in the bottom right corner that shows the Max Value.
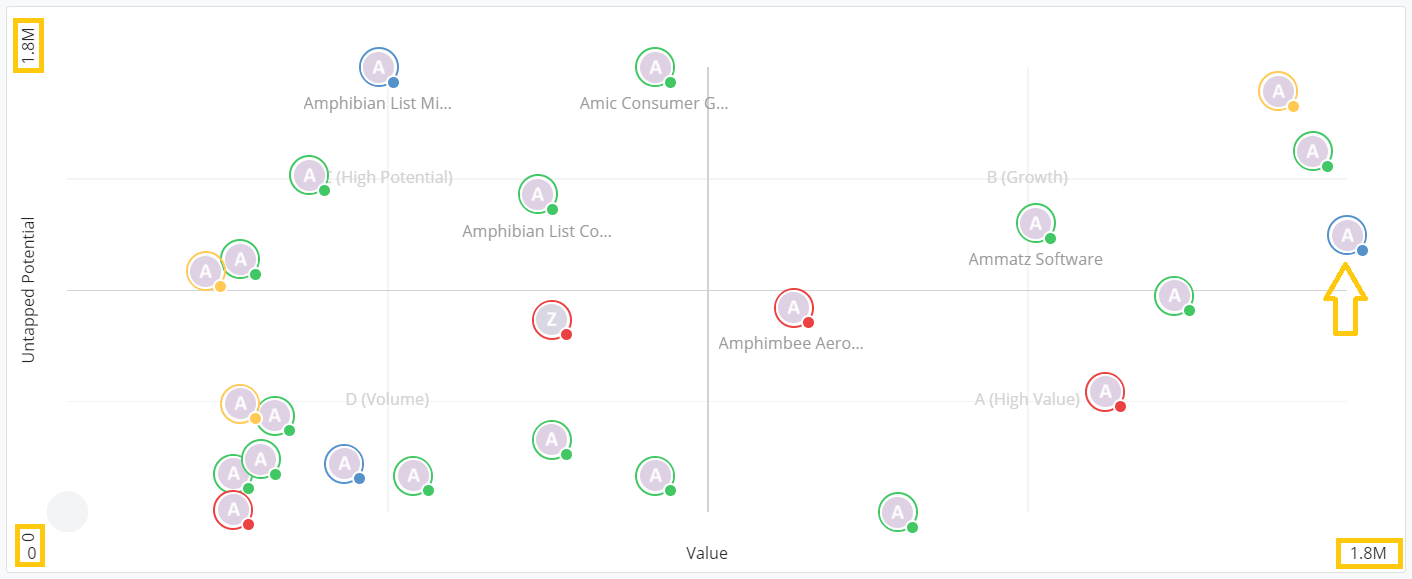
On the next screenshot, the Account with the arrow pointing at it in the first screenshot increases by 50% in Value. The new Max range for Value is therefore changed to 2.7M as shown in the bottom right corner and the Grid adjusts to its new Max Value by compressing all other Accounts to the left. (The reason that the Account has dropped downwards in the grid is that the Untapped Potential has decreased by the increased Value).
Although this might be an extreme case, we strongly recommend that you consider this when setting up your Growth Grid. Membrain is all about flexibility and if using Auto ranges suits your workflow best, it should of course be applied.
By customizing the Min, Mid, and Max range, the structural layout of the Growth Grid will have stability and you will be able to have control over the segmentation and positioning of the Accounts, rather than the Value of certain Accounts being able to control the Grid.
The Min and Max range is used to compress the visual layout of the Growth Grid and we recommend that you try different ranges until you feel that the visual segmentation of the grid feels right.
The Min range could represent an approximate average value of your smallest Accounts, or what you define should be the lowest value of the Accounts in this process. While the Max range could represent the opposite. If you have one account that stands out a lot in its value or potential, the ranges do not have to match that particular Account as it will determine the positioning of all the Accounts in the grid.
The Mid-range on Value configures the size of the four quadrants and will not affect the positioning of the Accounts, like Min and Max. Using Auto on Mid will always pick the middle value of Min and Max and the quadrant will be equal in size. By setting a custom Mid-range on Value, the vertical middle border will move left or right and adjust the size of the quadrant.
In this example, Min is set to 0, Max to 100 000, and Mid to Auto - making the middle border to be in the middle of the Grid.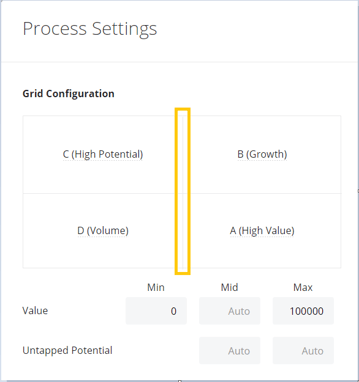
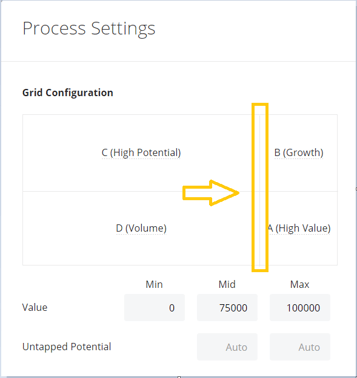
Changing the Mid-range to 75 000 makes the border move right, making the A and B quadrants more narrow.
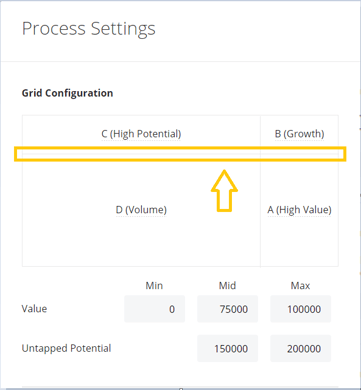
Different from the ranges of the Value, the Min range on Untapped Potential is not customizable and will always be set to 0. Mid and Max range on Untapped Potential works the same way as with the Value.
In this example, the Max is set to 200 000 and Mid to 150 000 (while Auto on Mid would have been 100 000. That makes the Horizontal middle border raise above the middle line.
You can apply Rules not just to the Account Growth Process, but specifically based on the Accounts a Quadrant. For instance, you might want to alert when x number of days have passed since you have the last meeting for an Account in the top right Quadrant (high Value and high Untapped Potential). Or you might want the team to make phone calls to Accounts in the top left Quadrant more often than the others, then you can set a Rule based on that.
Learn more on how to set up Rules in our Help Center article about Process Rules.
See Example 5 - No Review on top priority Accounts at the bottom of the article.
To learn more about how to work with the Growth Grid, read the article Working with the Growth Grid.