Popular Content
Membrain for:
Active Pipeline Analytics provides visibility to your sales project data in real-time, enabling proactive strategy adjustments. The analytics include a set of pre-defined and pre-formatted reports using your existing data.
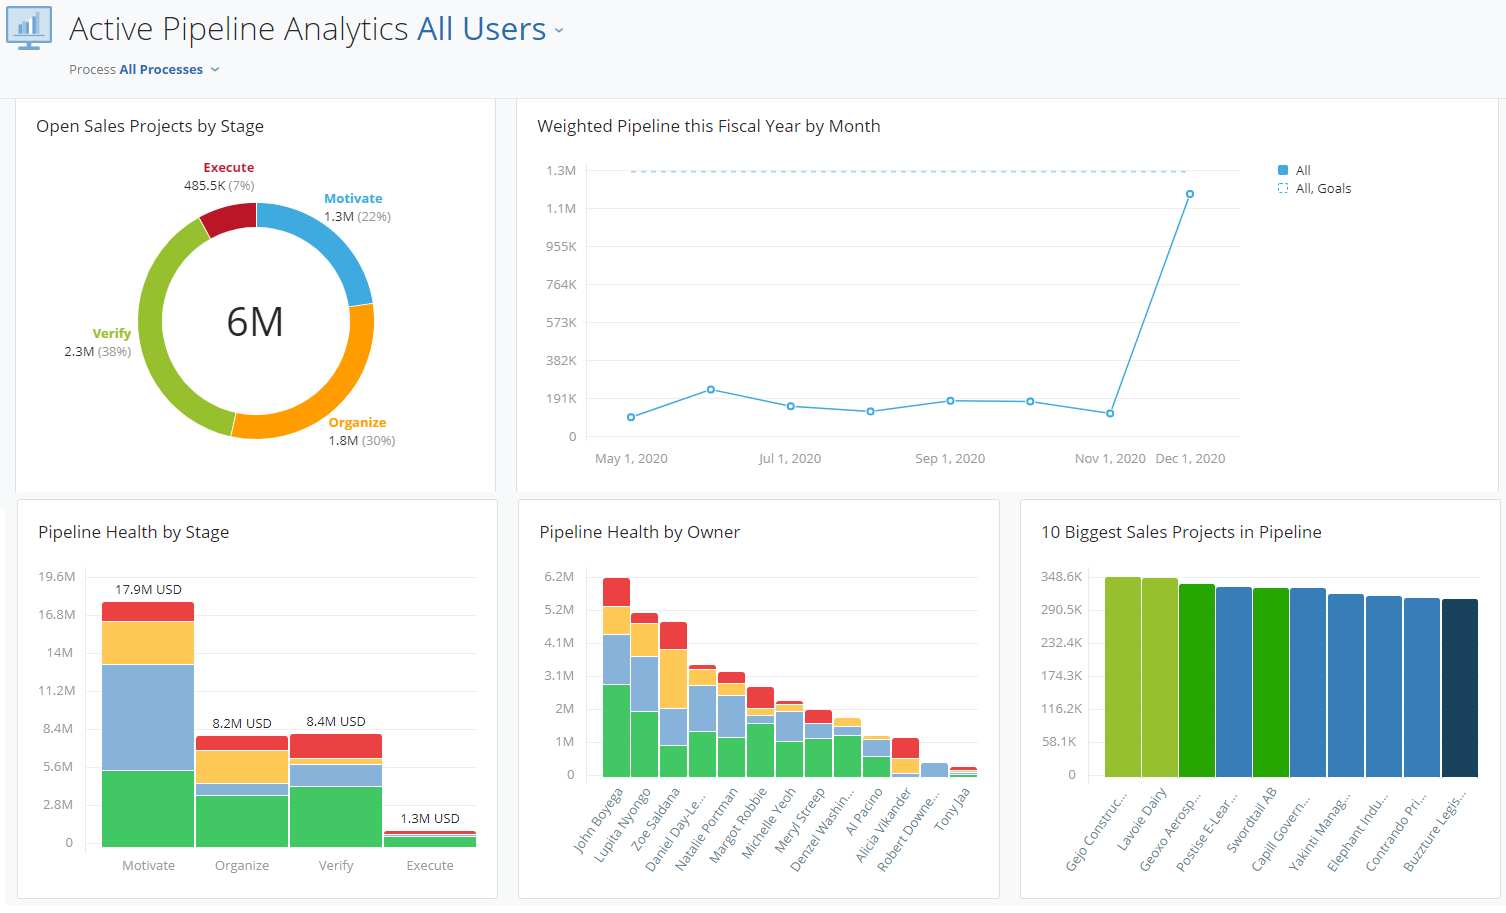
Two settings are available that you can change to see exactly what you want:
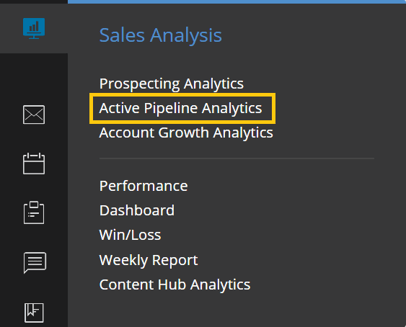
This allows you to select which people you want to see in the view. You can select all, one or more teams or one or more individuals. You can mix and match to easily create specific views of the data that you need. This list will automatically show all the people who have a sales project in the Active Pipeline.
The process selector allows you to select one or more processes. When selecting multiple processes the graphs will sum the results to show the total (or in some cases, average) of those processes.
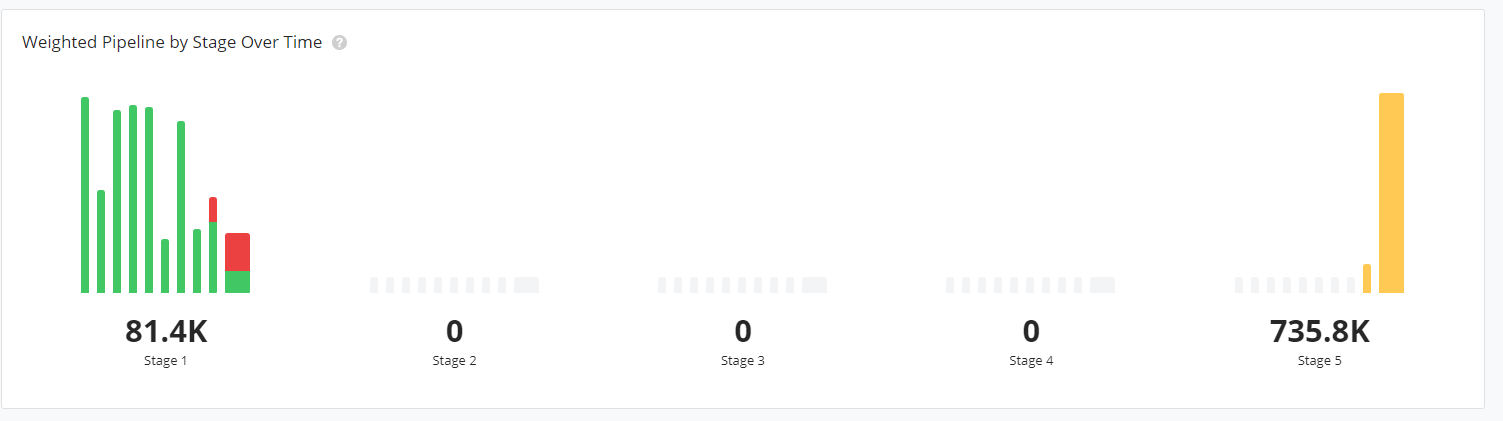
This graph shows the weighted pipeline value for each stage of the selected process(es), over time. The columns in each stage represent the average weighted pipeline value on a weekly basis, with the largest columns showing today's weighted pipeline value per stage. Columns may be segmented by color to show the health of the sales projects that make up these values, and hovering on a colored segment will show more detail.
Active Pipeline Analytics holds valuable insights, that perhaps others on the team would benefit from seeing. You may want to share these analytics with a particular team, or with the whole organization. .
An Administrator can change who has access to view Active Pipeline Analytics by giving permission for all users or specific teams access.


From north to south, east to west, Membrain has thousands of happy clients all over the world.