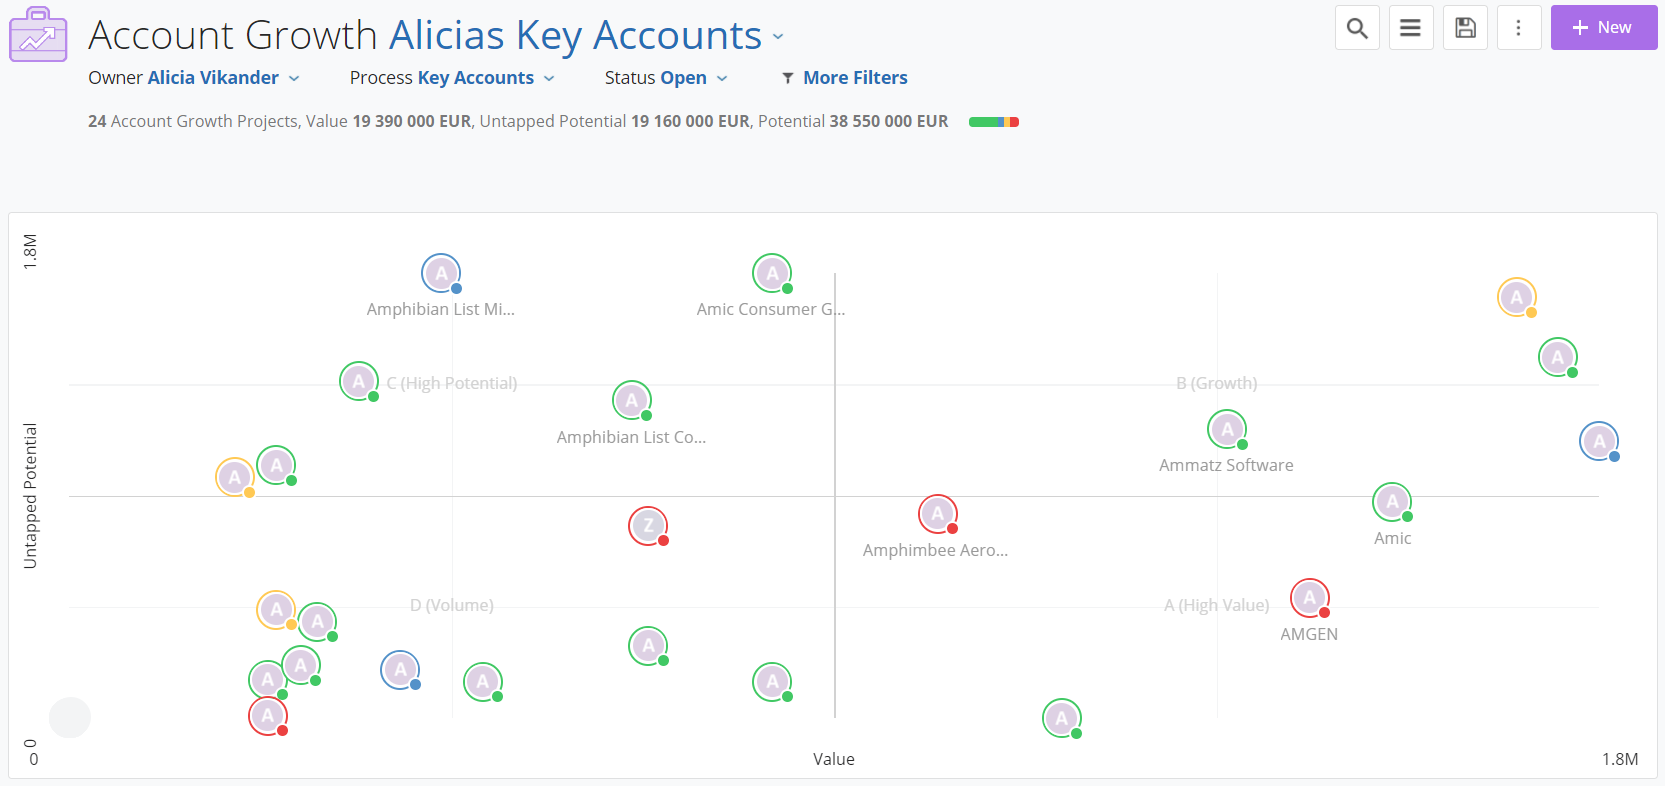
The Growth Grid will help you segment the Accounts in your portfolio into four different quadrants based on the horizontal axis that equals Value and the vertical axis that equals Untapped potential. In this article, you will learn how the Growth Grid is used in your daily work to give you an effective workflow, bring new insights, and acquire a high-level overview of your customers.
To be as efficient as possible working with the Growth Grid, we strongly recommend that you set up the Grid for each process you are using. Learn more about how the Growth Grid is set up in the article Setting up the Growth Grid.
The data on which the grid is based, is customizable and flexible, allowing you to design the characteristics that determine the value and potential scores of each account.
They’re also dynamic, allowing the grid to change over time as each account’s value and potential changes or as the characteristics on which you base them change.
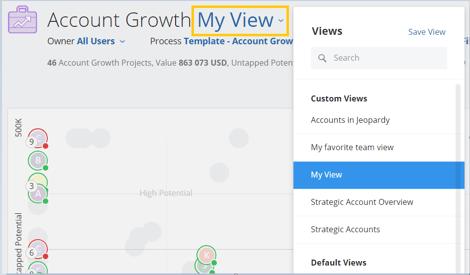
The overview perspective that you get with the Growth Grid can be viewed from different angles with the help of filters and will always show you the health (green, blue, yellow, or red) of each Account which makes it clearer where to focus.
Based on the present Value and Untapped Potential, your Accounts are divided into predefined quadrants of the grid, giving you a reliable segmentation of your Account portfolio.
To see more details on an Account that appears in the Grid, hover over the icon of the Account. It could for example be that you want to see the Owner of the Account or why it has yellow health.
To change what information is shown when Hover, go to Process Settings in the Process editor. Learn more on how to configure the Preview Settings.

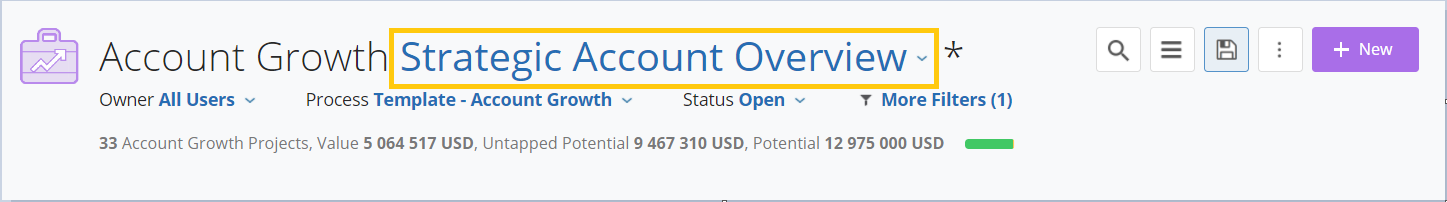
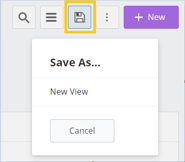
The filters and the menu of predefined filters on the Growth Grid have different functionality and layout than in other parts of Membrain and one of the most significant differences is that the Growth Grid focuses the most on saved Views. Rather than Owner or Account Manager being the visual main focus filter as in other parts of Membrain
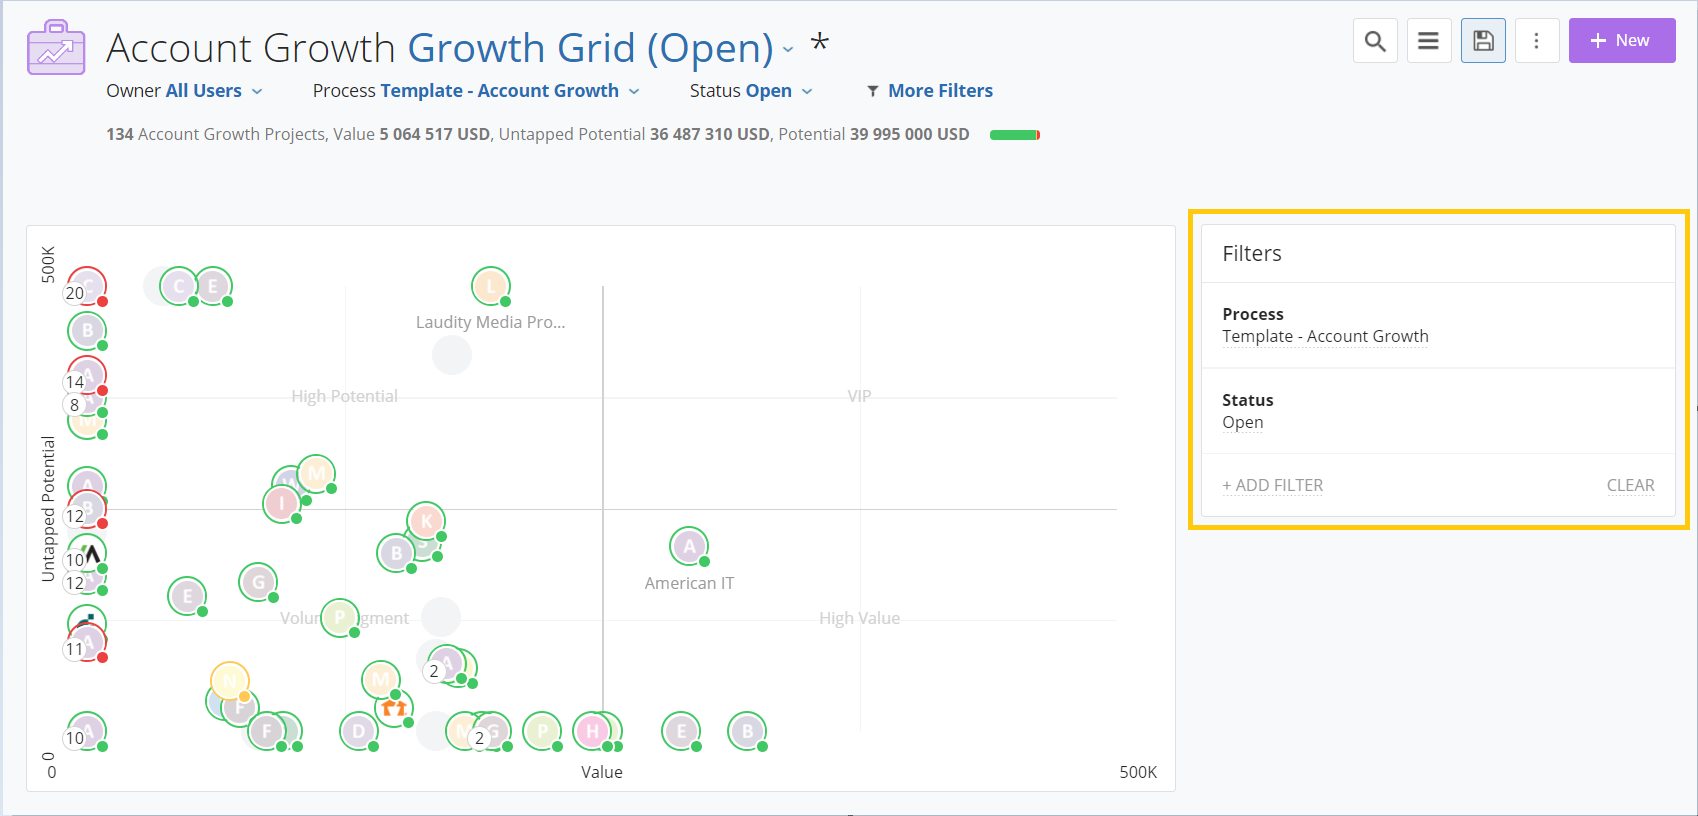
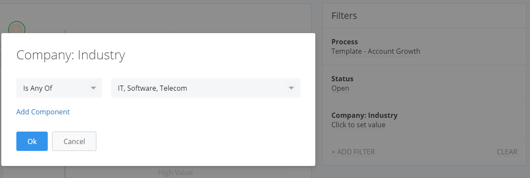
Another substantial difference when creating custom filters is that the Growth Grid uses inline filters that are not saved in the filter database of Membrain, but saved to a particular View.
In the example below, you want to build a Growth Grid view that shows all Open Accounts that are in the IT, Software, and Telecom industry.
The Growth Grid brings a top-of-the-line overview of your Accounts by segmenting them in the quadrants, to take it to the next level you can also Zoom in on the grid. With this function, you could for instance make a quadrant with lots of Accounts into its own grid, giving you an even more in-depth overview of that particular quadrant or segment.
By left-clicking with your mouse on a quadrant, that quadrant is focused and turned into its own grid. You can then double-click to zoom in further.
Another way to be more flexible and not zoom in on a specific quadrant is to hold down shift and use the mouse wheel. With Shift+mouse wheel, you can zoom in and out on your Grid. The focus for the zoom will be on where the mouse pointer is positioned.
While zoomed in you can also move around in the grid by holding down left-click and moving the position and to reset you click the button Reset Pan and Zoom.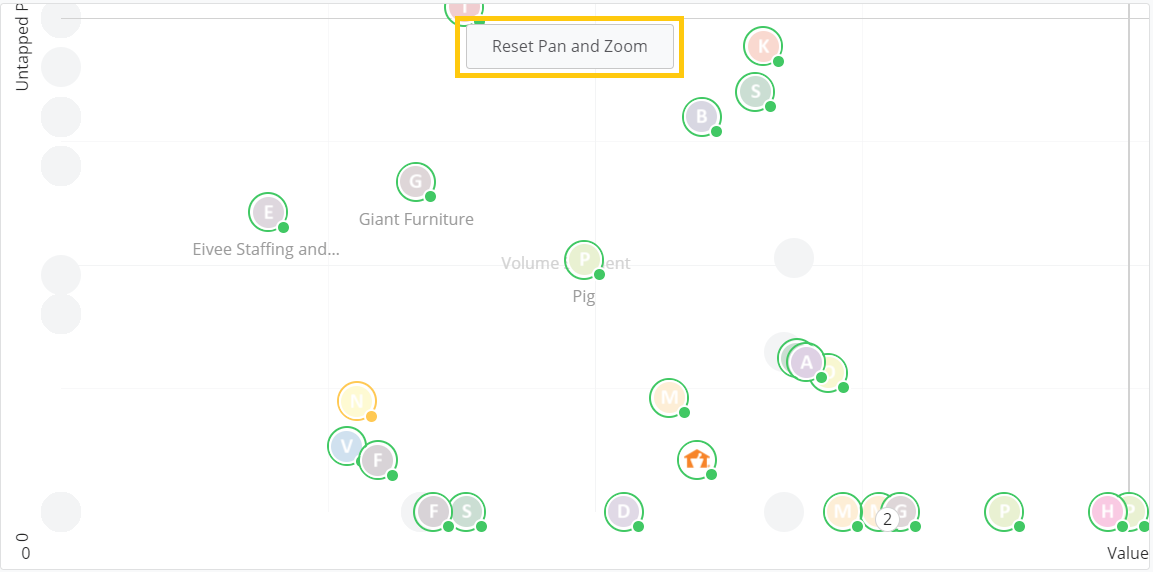
Membrain's Growth Grid also introduces the powerful functionality of a Grid History Viewer, akin to the Active Pipeline's History Viewer. This feature permits users to retrospectively analyze the historical progression of their Growth Grid.
Here's how to access and utilize this feature:
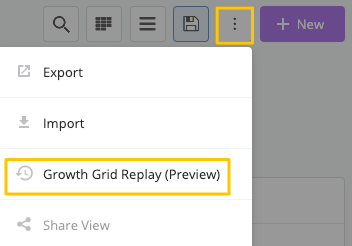
Once in the Account Growth Grid Replay, you'll notice a timeline with tools for navigating through your pipeline's history. Here's how to use them:
To move step by step through your Grid's history, use the forward and backward arrows.

To watch your Grid's evolution play out automatically, use the 'play' button. You can pause this playback at any time.

To go to a specific point in your Grid's history, click anywhere on the timeline's scrubber.


The colors that you see in the Growth Grid are important and help you understand what the health of an account growth project is, at a glance.
There are 3 different alerts that can be triggered, based on rules in your process, and on the steps themselves. These settings are configured by your administrator on setup.
![]() Blue Puzzle Piece - coaching advice is the first level and shows you that something needs to be addressed, even if it is not urgent yet.
Blue Puzzle Piece - coaching advice is the first level and shows you that something needs to be addressed, even if it is not urgent yet.
![]() The next level is a yellow flag, where quick action is required to address the problem at hand.
The next level is a yellow flag, where quick action is required to address the problem at hand.
![]() The final level is the red flag – this is the most serious of warnings Membrain can give and it should not be ignored. Something very important has been missed that may impact the success of this opportunity or prospect.
The final level is the red flag – this is the most serious of warnings Membrain can give and it should not be ignored. Something very important has been missed that may impact the success of this opportunity or prospect.
As shown in the previous screenshots, the health of each Account is shown clearly in the Growth Grid by the color of the frame and the little dot surrounding the Account Icon
![]()
![]()
![]()
![]()
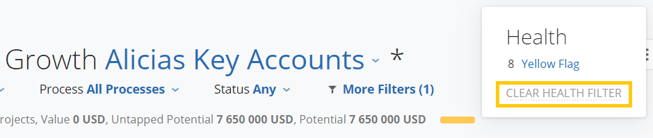
This tool shows the overall health of the Accounts in your View, and hovering on the Health Bar gives you a preview of the health conditions.
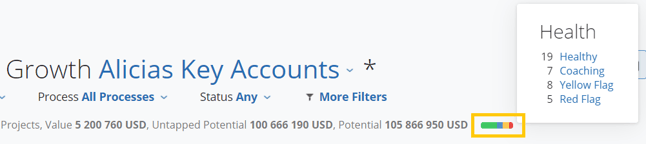
Clicking on one of the health conditions applies it as a filter. For instance, if you select "Yellow Flag" from this preview dialog you will only see the Accounts that have a Yellow flag as the health condition.
To reset the filter and switch back to see all your Accounts, you simply hover on the Health Bar again and click Clear Health Filter.