Popular Content
Membrain for:
The Prospecting Overview provides a high-level summary of your prospecting efforts across all active prospecting processes. Instead of focusing on individual prospects, this view helps you understand the overall health, activity, progress, and outcomes of each process so you can quickly identify where attention is needed.
Each row in the Overview represents a Prospecting Process and combines key metrics with visual indicators that make it easier to spot trends, stalled activity, and conversion patterns. From the Overview, you can also drill into the prospects behind any metric without needing to build filters manually.
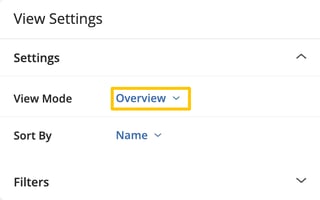
The Prospecting Overview is available as a View Mode within Prospecting.
To access it, open a Prospecting view and click View Settings. Under View Mode, select Overview.
The Prospecting Overview reflects the prospects currently included in your view. Any filters you apply, such as Owner, Process, or other view filters, will automatically update the metrics and visualizations so you are always looking at the data that matches your current focus.
You can also save an Overview configuration as a custom view, making it easy to return to the same perspective later.
The Prospecting Overview is most useful when you want to evaluate the health and momentum of your prospecting efforts across multiple processes.
For example, you might use it to identify processes with a large number of open prospects but very little recent progress, review where prospects are accumulating within a process, or compare qualification outcomes across different prospecting initiatives.
Because the view combines activity, progress, health, and outcome information in a single place, it becomes much easier to identify where coaching, cleanup, or follow-up efforts will have the greatest impact.
Each row in the Overview represents a Prospecting Process.
On the left, you'll see the name of the process along with the owners currently assigned to prospects within that process. The remainder of the row is divided into five key areas: New, Open, Progress, Activity, and Outcome.
Each section contains both a numeric summary and a visual representation of the same data, giving you two different ways to understand what is happening within the process.
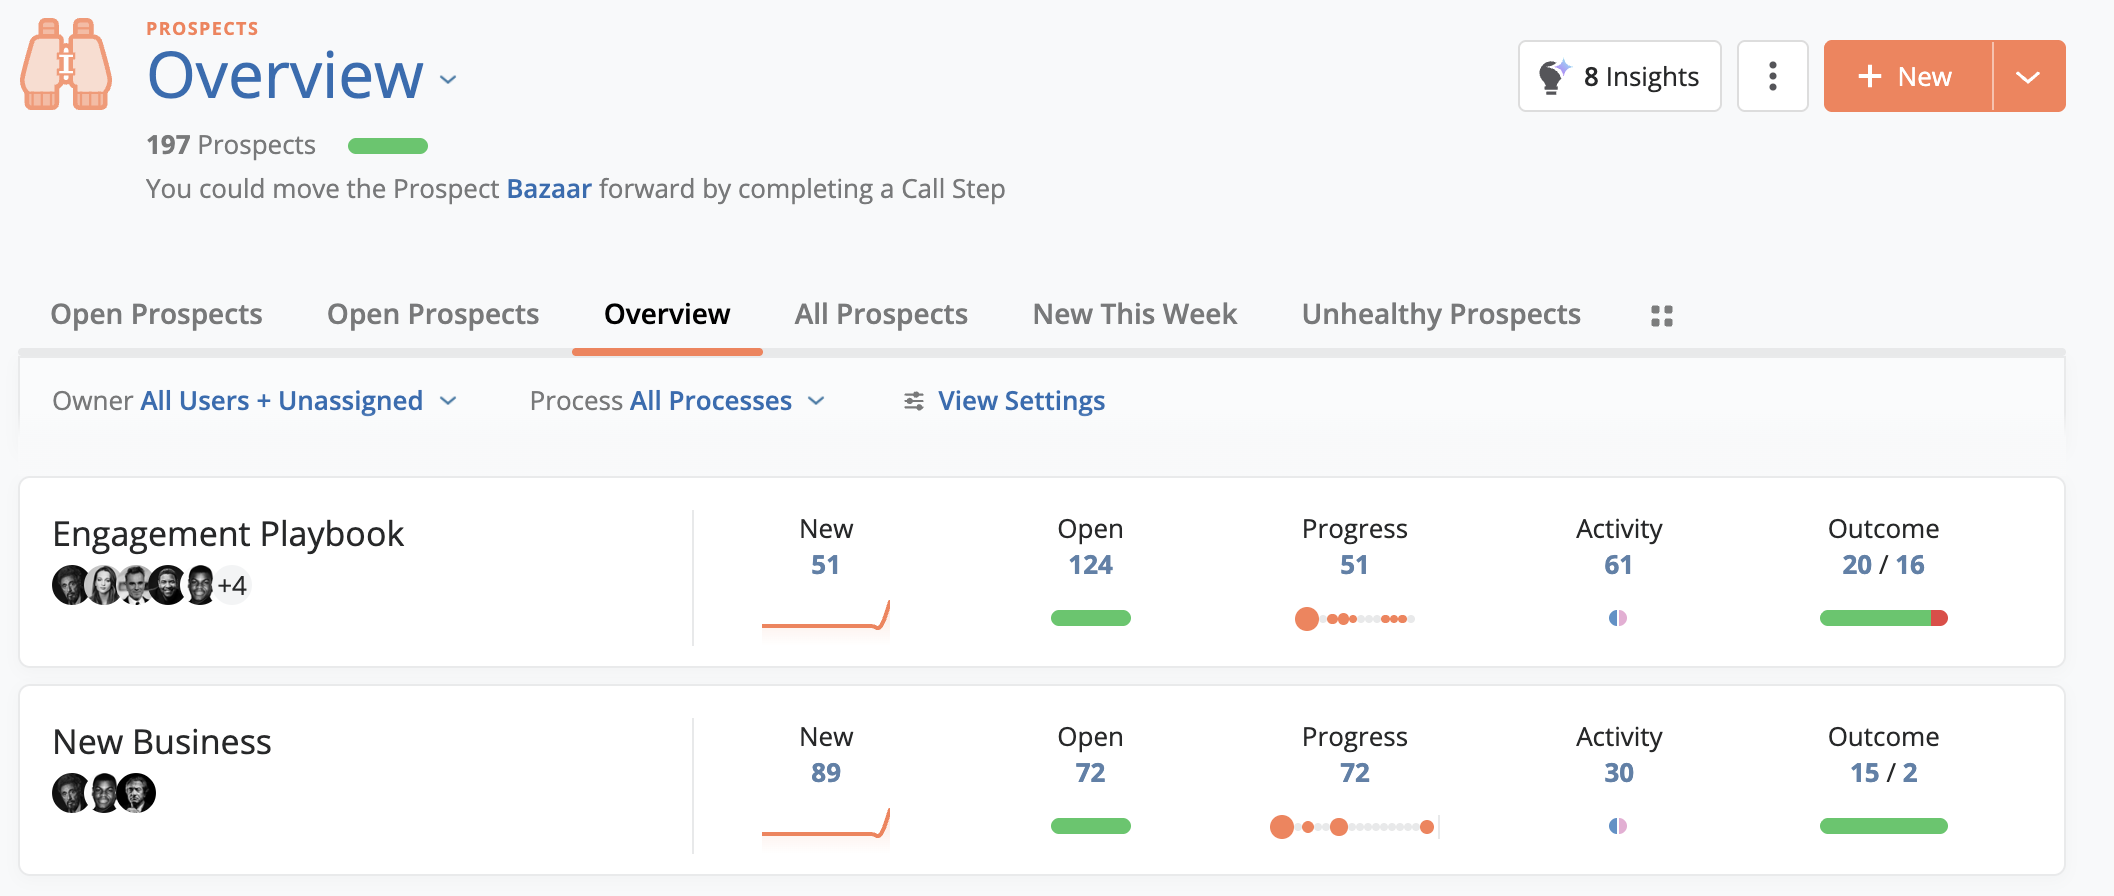
The New column shows how many prospects have been created within the process during the last 14 days.
Below the count, an area graph visualizes how those prospects were created over time. This helps you quickly determine whether new prospects are arriving consistently or whether they were added in larger batches.
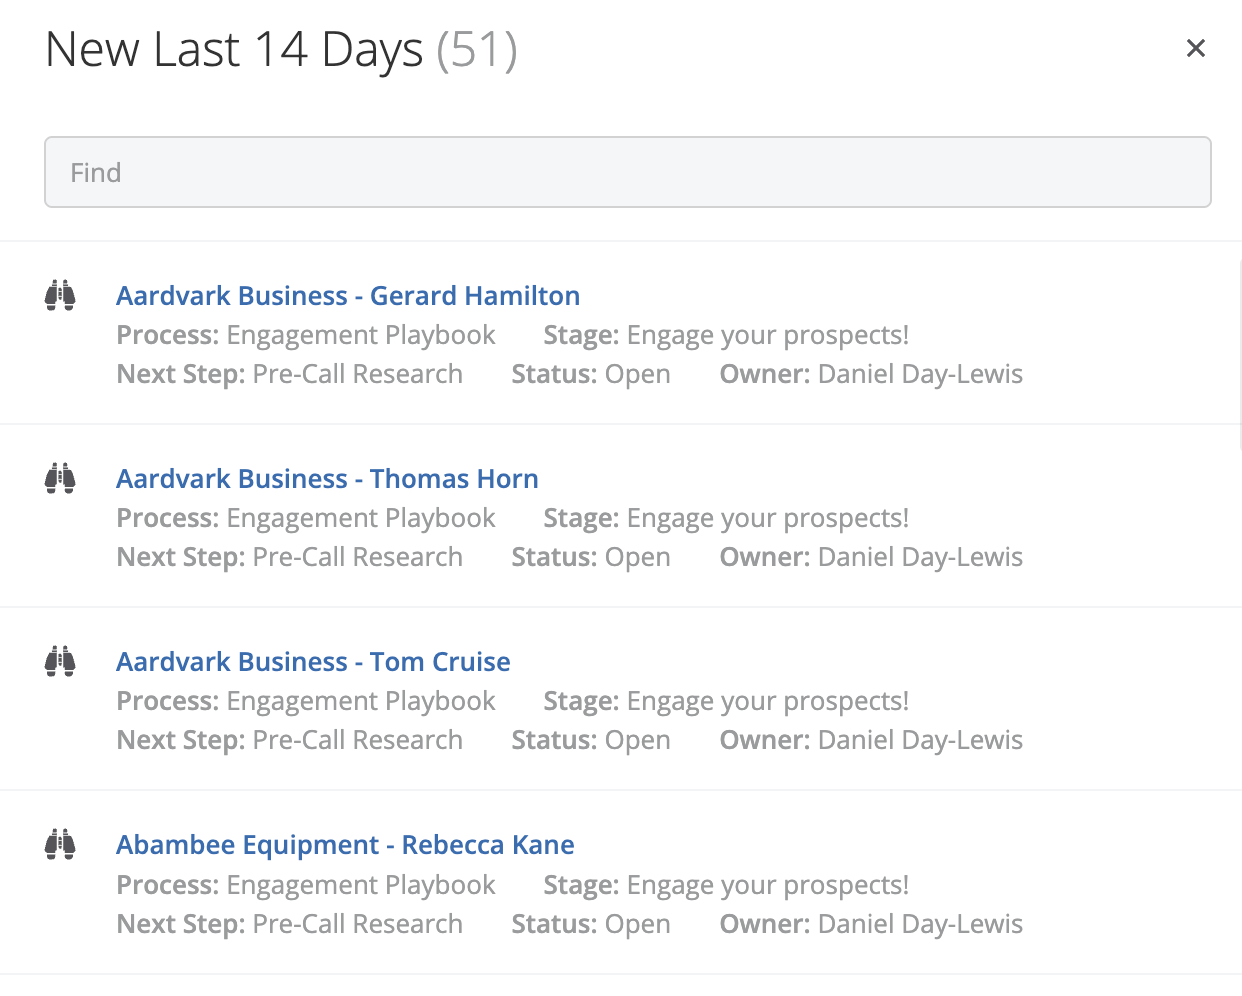
Selecting the number opens the More Items Viewer, allowing you to see the prospects that make up that count.

The Open column shows the total number of open prospects currently in the process.
Beneath the count, health indicators provide additional insight into the condition of those prospects. These indicators help highlight potential issues and opportunities that may require attention.
For more information about prospect health indicators, see our article on Prospect Health.
Selecting the Open count displays the matching prospects in the More Items Viewer.

The Progress column shows how many prospects have advanced within the process during the last 14 days.
The visualization below the count displays each step in the process as a circle. The larger the circle, the more prospects currently exist in that step. This makes it easy to identify where prospects are accumulating and where movement may be slowing down.
Selecting the Progress count displays the prospects that have progressed during the selected period.

The Activity column shows prospects that have had activity during the last 14 days or have future activity scheduled.
Below the count, the visualization displays activity and engagement information, helping you understand how actively prospects are being worked and how they are responding.
For more information about Activity and Engagement metrics, see our article on Activity & Engagement.
Selecting the Activity count displays the prospects contributing to the metric.

The Outcome column shows qualification and disqualification results from the last 30 days.
The count at the top displays how many prospects have been qualified and disqualified, while the visualization below provides a graphical representation of those outcomes. This makes it easy to compare conversion performance across different prospecting processes.
Selecting either value displays the corresponding prospects in the More Items Viewer.

Every numeric value in the Prospecting Overview can be selected to reveal the prospects behind the metric.
When selected, the More Items Viewer opens and displays up to the first 100 matching prospects. This allows you to move from a high-level overview directly into the records that are driving the numbers.
Whether you're investigating inactive prospects, reviewing recently qualified opportunities, or looking at prospects with recent activity, the More Items Viewer provides a quick way to drill deeper without leaving the Overview.